
 Rebounds From $80 Floor, But Analysts Warn of Deeper Decline Ahead")
Key Highlights
- Solana gained 3% over 24 hours after briefly testing the $80 price floor
- Daily trading volume jumped nearly 90%, climbing to $3.7 billion
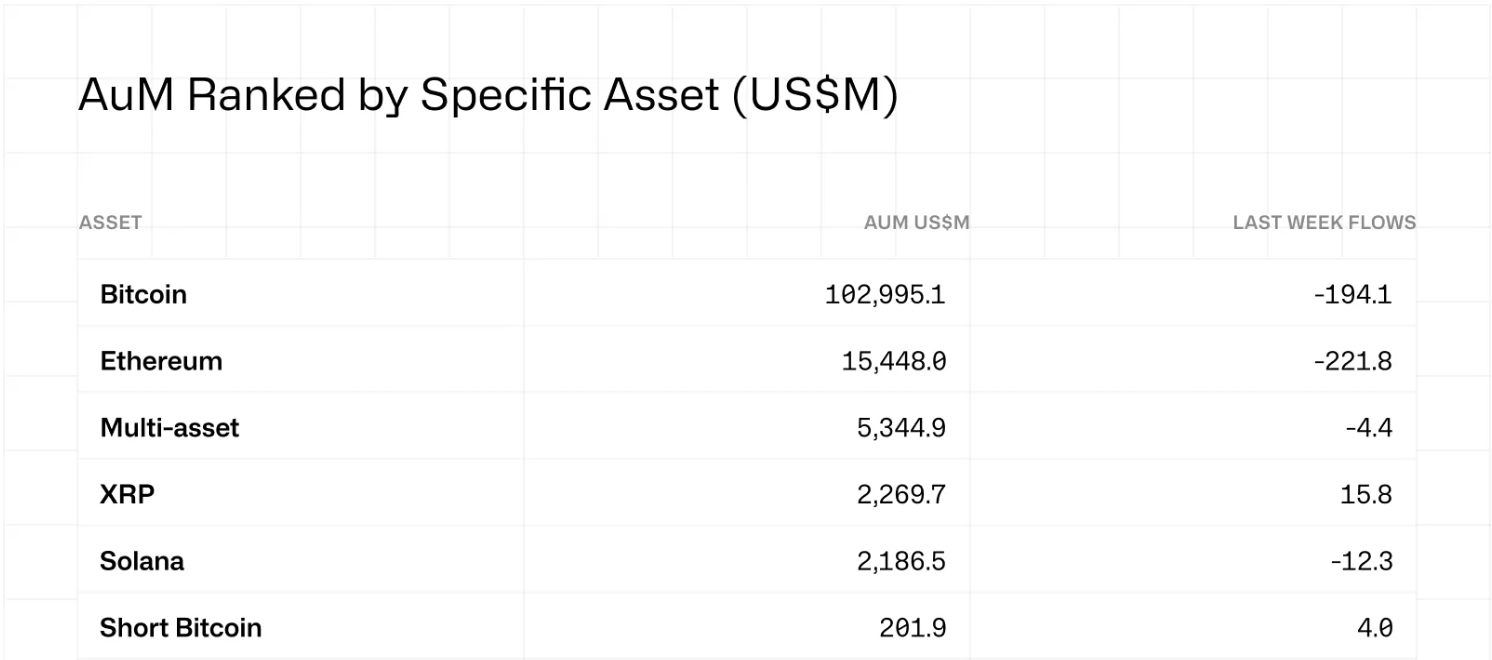
- Digital asset ETFs recorded $414 million in net outflows during their first negative week in over a month
- Critical resistance zone lies between $84 and $85; falling below $78 may trigger a decline to $67
- Market watchers identify the $70–$80 range as a potential long-term accumulation area
Solana is currently hovering near $82 following a rebound from the psychologically important $80 threshold. While the token posted a modest 3% uptick in the last day, ending a four-session slide, market experts remain cautious about declaring a sustainable turnaround.
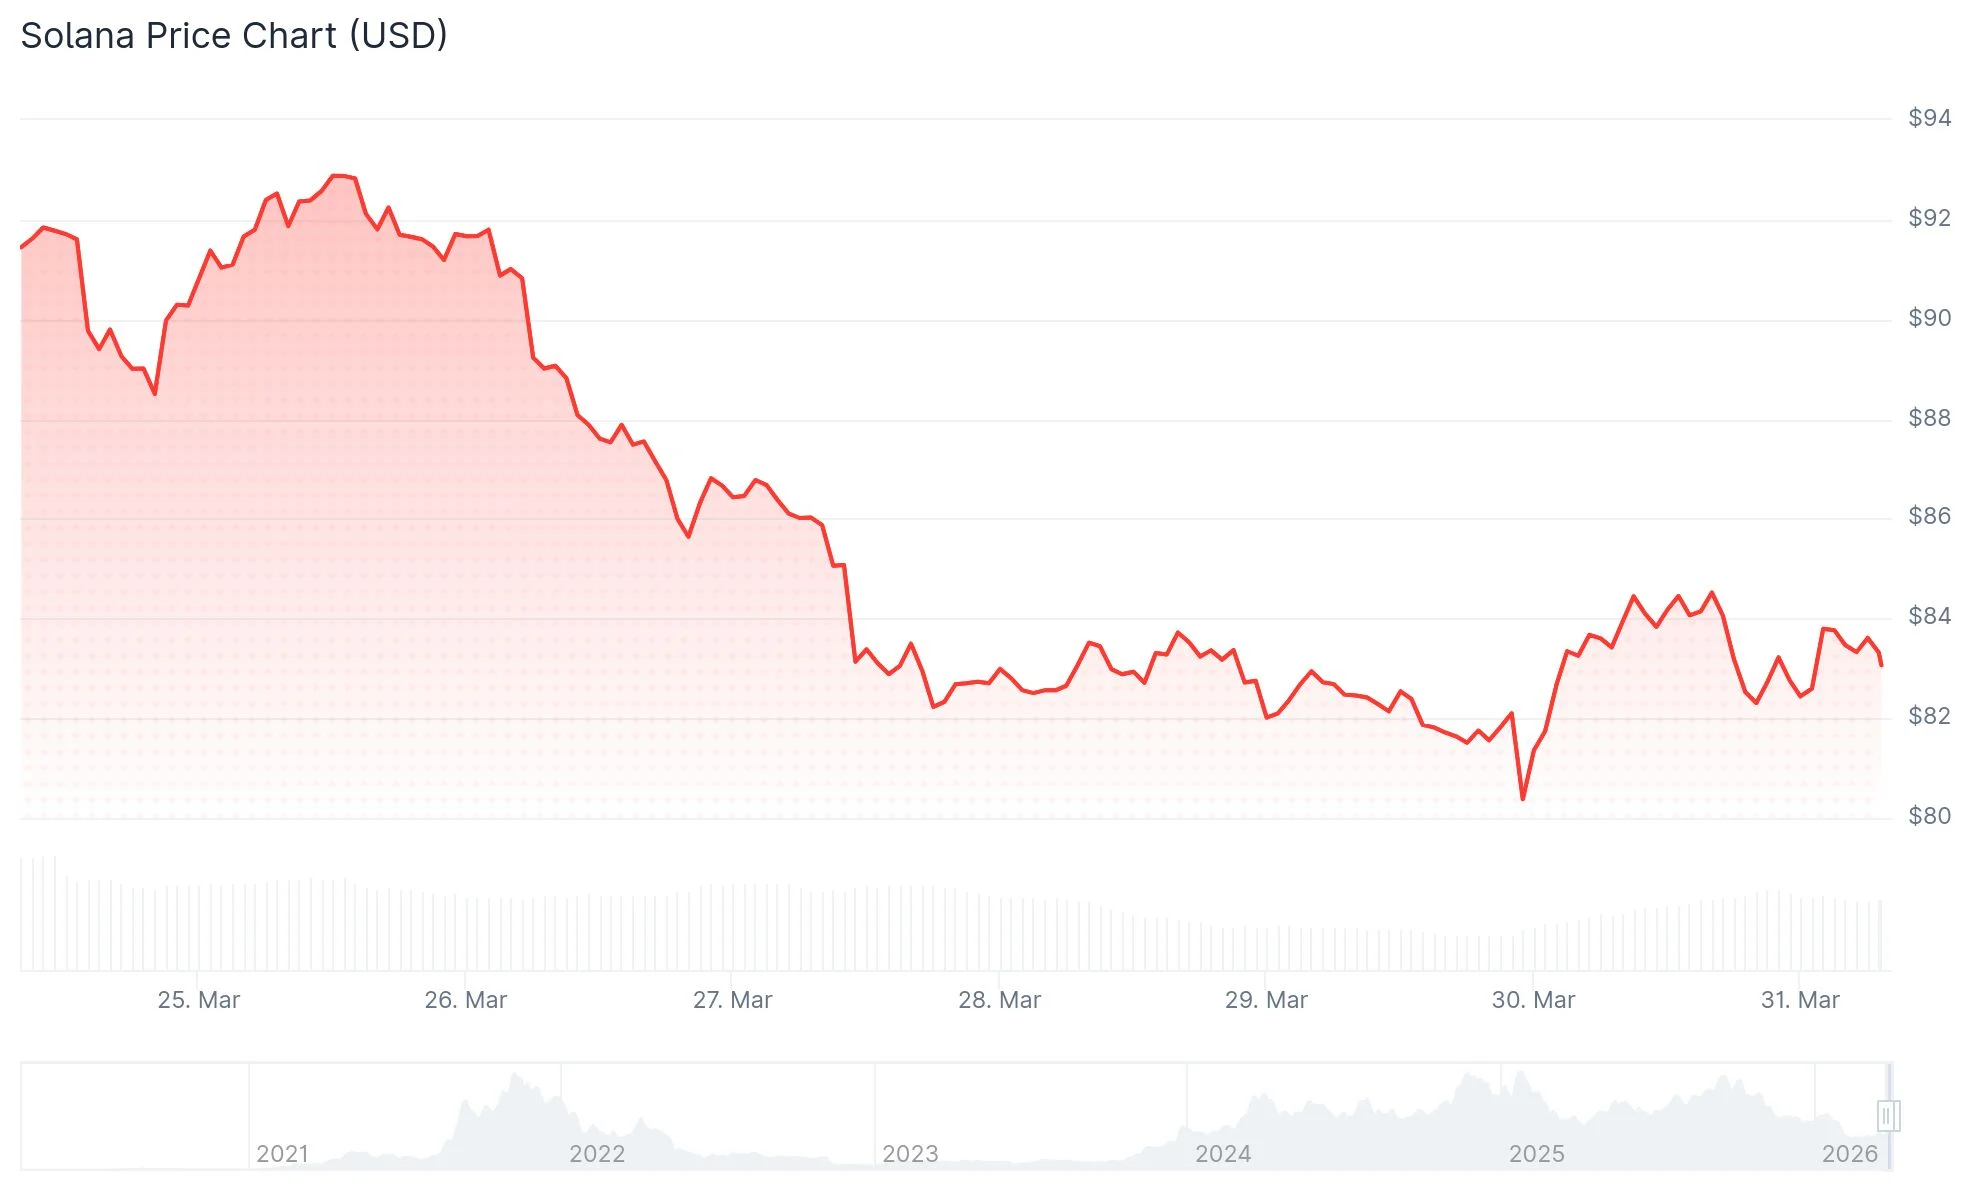
Daily trading activity spiked by approximately 90% during the bounce, pushing volume to $3.7 billion. This figure represents roughly 8% of SOL’s total market capitalization in circulation.
The uptick from $80 appears to be a technical response to a well-defined support threshold. Institutional players may have positioned buy orders at this psychological level, though this doesn’t necessarily indicate a broader trend shift.
A genuine bullish confirmation would require SOL to climb back above $90. That move would signal an escape from the current sideways trading pattern.
The Relative Strength Index has dipped beneath 40 and crossed below its 14-period moving average. These indicators suggest increasing downside pressure in the near term.
Critical Price Zones That Matter Most
The $84–$85 range represents the immediate overhead resistance that Solana must overcome. This area previously served as a floor before the recent breakdown, making a recapture especially significant.
Should bulls maintain control above this threshold, technical analysts project possible advances toward $88, followed by $92. Conversely, losing the $82 level could prompt another test of the $78 demand area.
The most significant downside risk emerges below $78. Market analysts warn that a breach of this level could drive Solana toward $67—the February 6 bottom—representing approximately a 20% decline from present valuations.
Trading analyst Ali Charts highlighted on X that downside objectives of $74.11 and $50.18 are still viable for SOL should the current bearish structure persist.
Broader Market Forces Fueling Downward Pressure
Digital asset exchange-traded funds experienced $414 million in net redemptions during the previous week, snapping a four-week run of positive capital flows. According to CoinShares researcher James Butterfill, this reversal stems from investor anxiety surrounding Middle East tensions and mounting inflation concerns.
Crude oil valuations have returned above $100 per barrel after a temporary retreat below $90. The ongoing closure of the Strait of Hormuz continues to support elevated energy prices.
Escalating energy costs amplify inflation worries, potentially compelling the Federal Reserve to maintain restrictive monetary policy longer than anticipated. Such conditions typically create headwinds for speculative assets including cryptocurrencies.
The Crypto Fear and Greed Index tumbled from 46 (Neutral territory) to 27 (Fear zone), mirroring the prevailing risk-averse sentiment across markets.
Market commentator Ted Pillows noted on X that corporate Solana holders continue offloading their positions without corresponding buyer interest. He raised the possibility of SOL reaching $50 during 2026.
At publication time, SOL is changing hands at $82.30, maintaining approximately 10% in losses over the past seven days.