
 Skyrockets 6,000%: Analyzing the On-Chain Signals Behind the Surge")
Key Highlights
- RAVE experienced a 6,000% price explosion over seven days, propelling its market capitalization to $4.1B and securing the 22nd global ranking above Avalanche and Sui.
- Blockchain analytics reveal 90% of circulating RAVE tokens concentrated in three wallets linked to the project, with 18.58M tokens transferred to Bitget shortly before the rally.
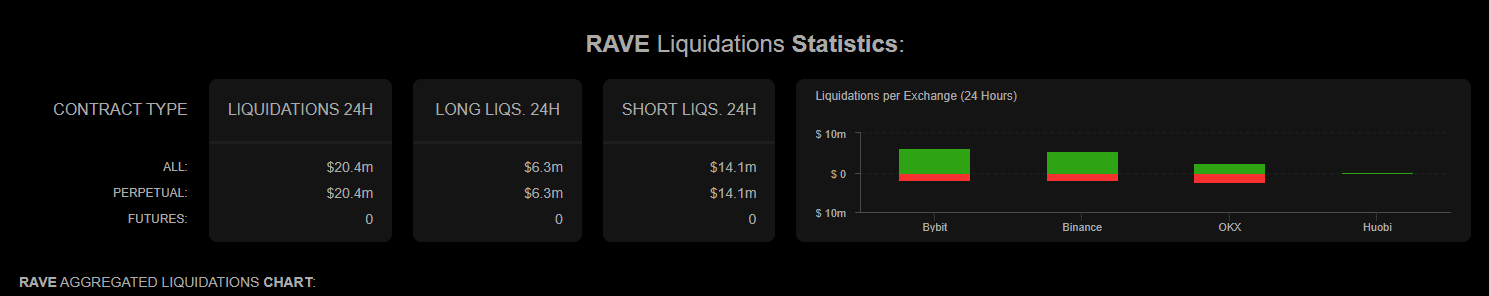
- This strategic token movement preceded massive short position liquidations totaling $17M–$21.72M in a single day, while long positions suffered only $7.12M in losses.
- Technical indicators showed extreme overbought conditions with RSI reaching 99.59 and price trading $4 beyond the upper Bollinger Band, as derivatives volume declined 25% and open interest retreated from its $494M high.
- KuCoin exchange added RAVE trading pairs on April 17, 2026, expanding accessibility for the token across major platforms.
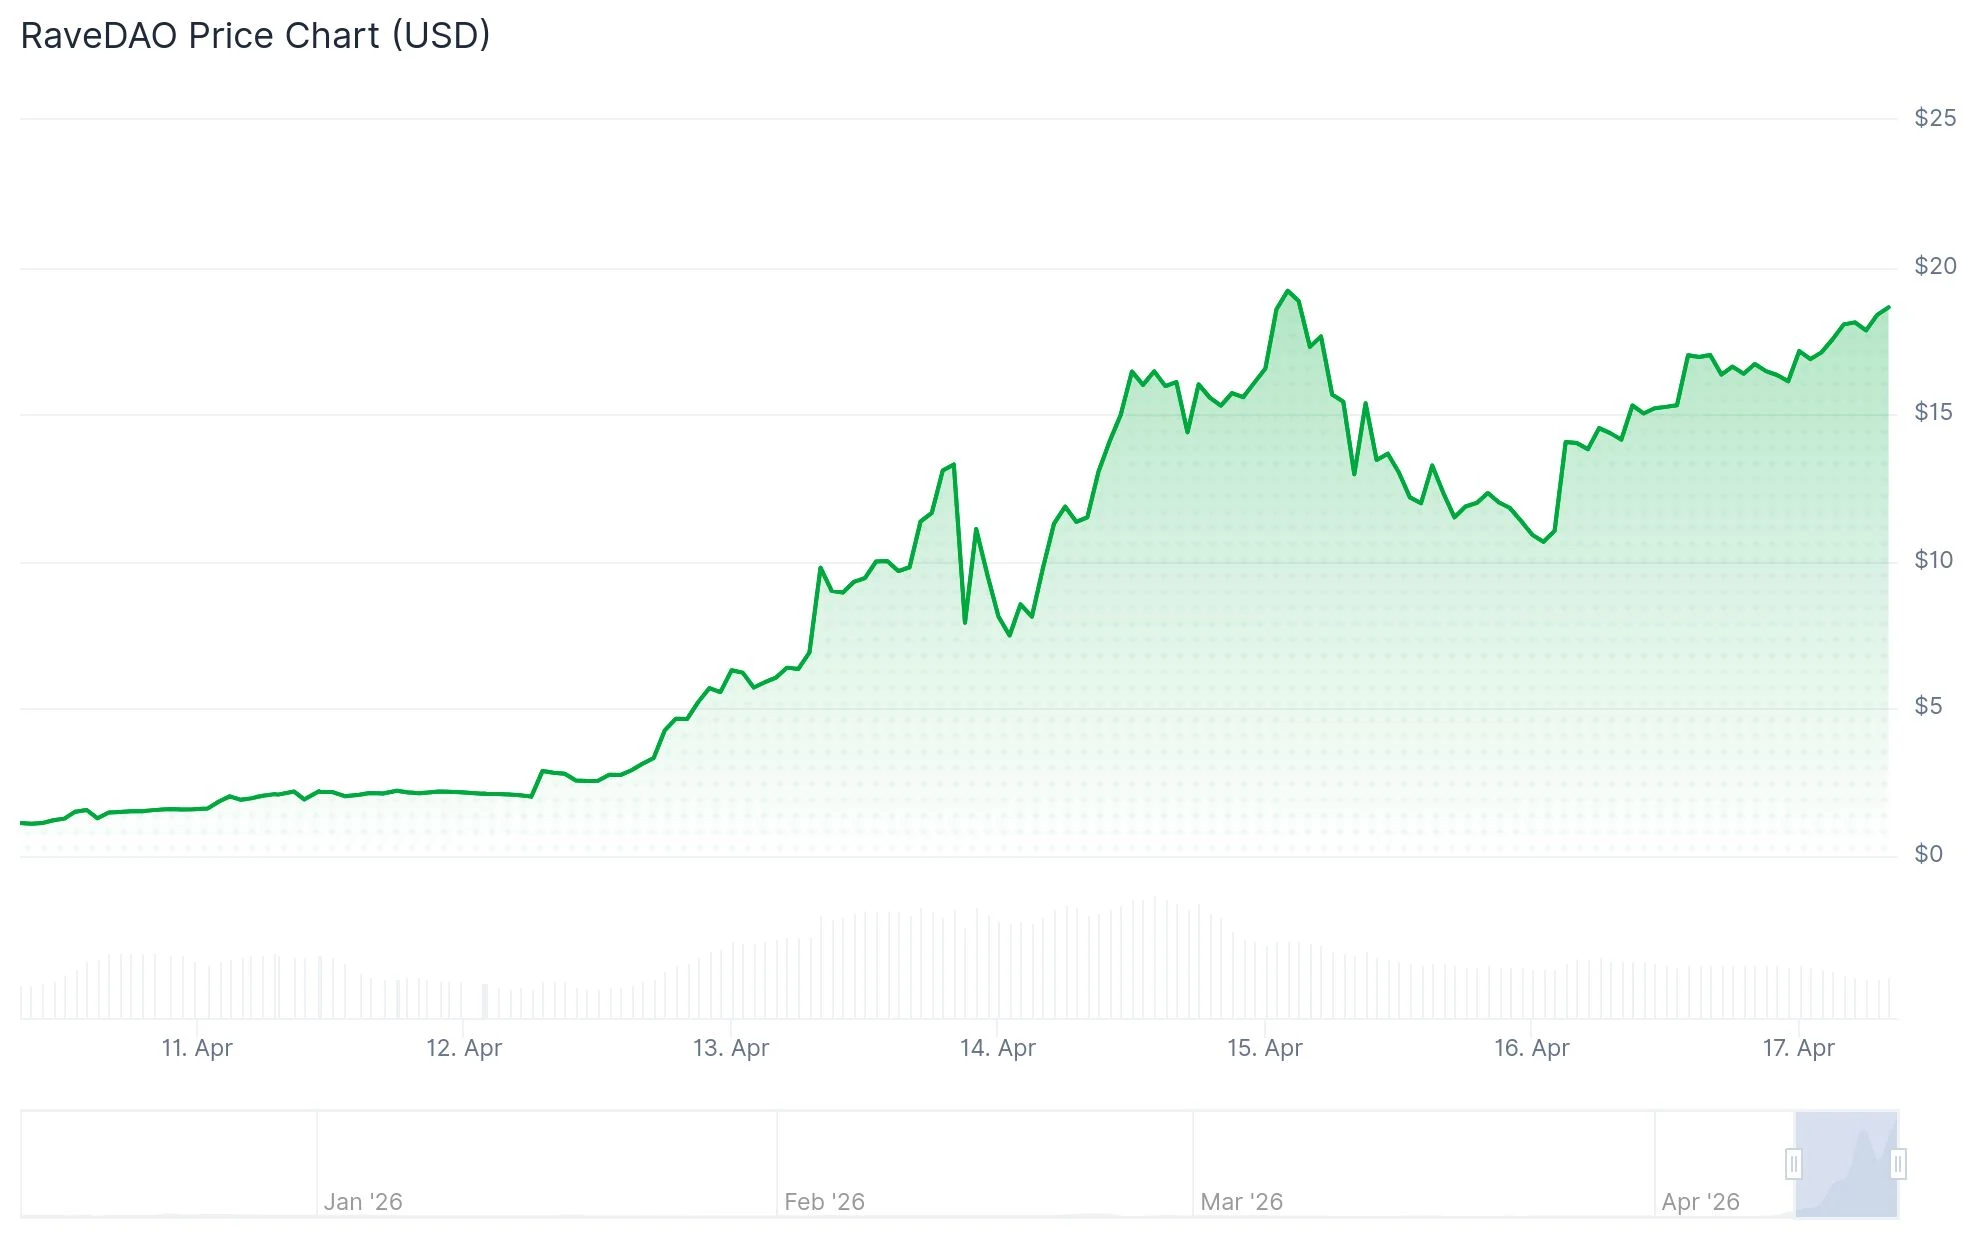
For months, RAVE maintained a stable trading range around $0.20 throughout January and the first weeks of April 2026. Then came an unprecedented seven-day rocket launch that catapulted the token over 6,000%, peaking at a session high of $19.771 before stabilizing at $16.74—representing a modest 1.09% daily increase at the time of analysis. This remarkable ascent elevated its market valuation to $4.1B, securing the 22nd position in global cryptocurrency rankings and surpassing well-established blockchain networks like Avalanche and Sui.
Notably absent from this explosive price action were typical catalysts: no groundbreaking product releases, no strategic partnerships announced, and no revenue disclosures to justify the valuation surge.
Blockchain forensics reveal a highly concentrated token distribution pattern. Approximately 90% of RAVE’s entire supply resides within three Gnosis Safe wallets directly connected to the project. In the hours immediately preceding the price eruption, 18.58 million tokens were moved to the Bitget exchange platform. This substantial transfer occurred right before a devastating cascade of short liquidations that eliminated $17M–$21.72M worth of bearish leveraged positions in just 24 hours, while bullish long positions experienced comparatively minimal losses of only $7.12M.
Technical Indicators Signal Extreme Overbought Territory
From a technical analysis perspective, RAVE’s price chart displayed some of the most exaggerated readings imaginable. The Relative Strength Index soared to 99.59, approaching the theoretical maximum threshold. The token’s price floated nearly $4 above the upper Bollinger Band threshold positioned at $12.946. The median Bollinger Band registered at $2.805, with the pre-breakout consolidation zone hovering between $0.20–$0.25. A previous RSI surge during March similarly reached extreme overbought territory before experiencing a rapid downward correction.
Derivatives market metrics provided additional context. Open interest reached its zenith near $494M before contracting to the $448.91M–$458.52M range. Trading volume experienced a 25.04% decline, settling at $10.29B. On Binance, trader positioning skewed bearish with a 0.6656 ratio, whereas OKX participants favored bullish positions at 1.1.
Price Retracement Phase and Major Exchange Integration
By April 15, RAVE transitioned into what market observers characterized as a managed correction period. The Stochastic RSI indicator drifted toward oversold readings, while short liquidations escalated to $14M over 24 hours, indicating continued pressure on bearish positions. Open interest expanded to $141M throughout this correction phase despite declining prices, which technical analysts interpreted as strategic repositioning rather than wholesale market exit.
On April 17, 2026, KuCoin exchange formally integrated RAVE for spot market trading paired with USDT, enabling immediate deposits with withdrawal functionality commencing April 18.