
 Struggles to Breach $2,400 Barrier as Whale Distribution Intensifies")
Key Takeaways
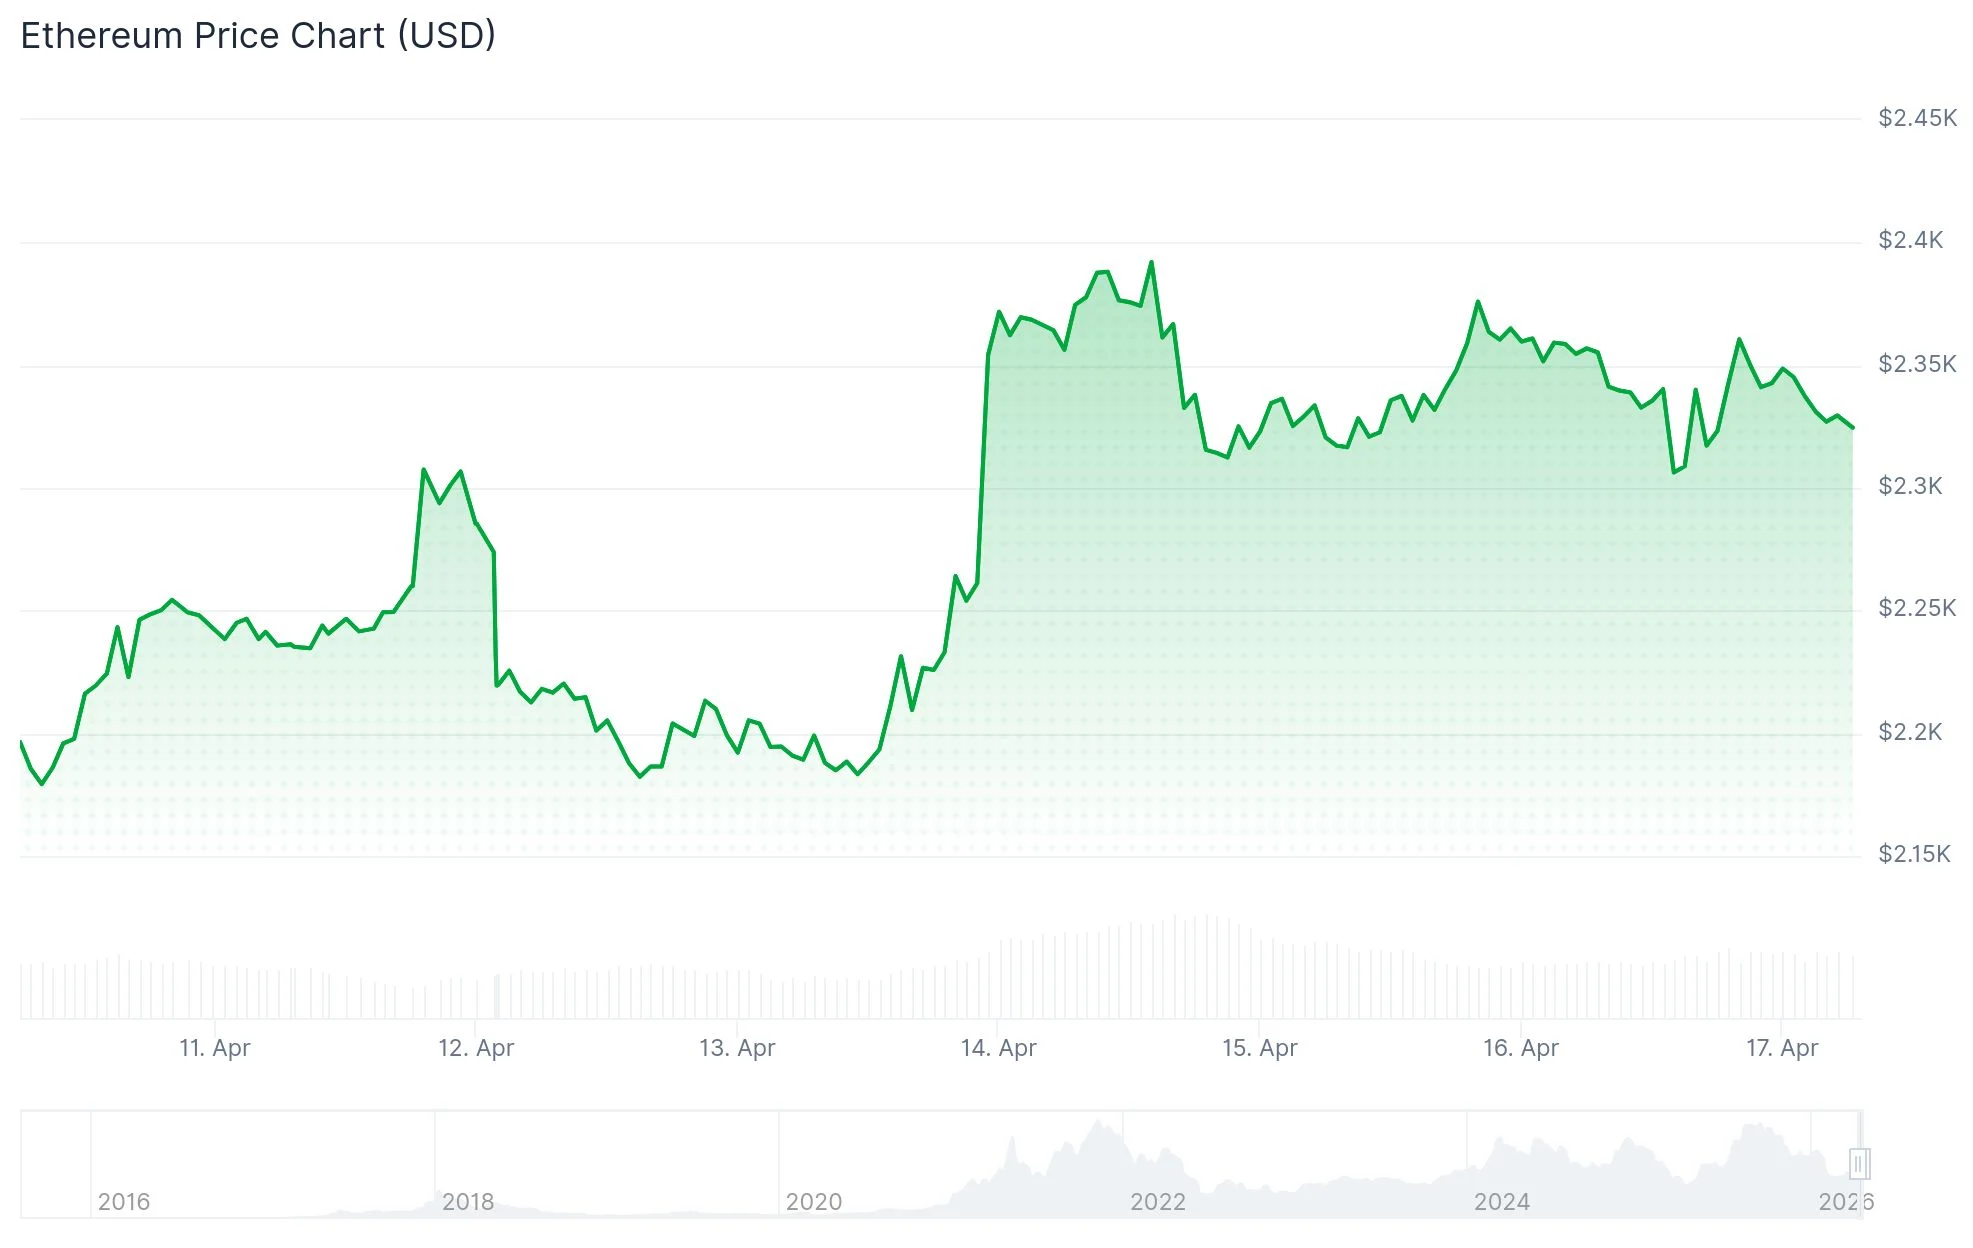
- Ethereum reached $2,417 before encountering selling pressure that drove prices lower
- Critical resistance zone exists between $2,360–$2,400; downside support established around $2,190–$2,295
- Large wallet holders have distributed approximately 60K ETH following a return to break-even pricing
- Futures market open interest remains stagnant at 14.2 million ETH without further growth
- Spot Ethereum ETFs in the United States recorded consecutive inflows for five days, adding $67.8M on Wednesday alone
Ethereum’s price action reached $2,417 during its recent advance before encountering resistance that forced a retreat below $2,350. This rejection at a closely monitored technical barrier has captured the attention of market observers.
Current trading sits marginally above $2,300, maintaining position above the 100-hourly Simple Moving Average. Selling pressure concentrates around $2,360, where a descending trend line compounds the challenge for buyers.
Resistance layers stack densely between $2,360 and $2,420. Successfully clearing $2,420 would establish a pathway toward $2,450, followed by $2,500 and potentially $2,550. For downside scenarios, initial support appears at $2,295, with subsequent levels at $2,265 and $2,200 providing additional cushioning.
The daily timeframe reveals ETH maintaining ground above both the 20-day and 50-day exponential moving averages positioned at $2,214 and $2,190 respectively. The Relative Strength Index registers approximately 61, indicating moderate bullish momentum, while the Stochastic Oscillator hovering near 84 suggests potentially overbought territory that may temper further advancement.
The 100-day EMA stationed at $2,376 functions as near-term resistance, positioned slightly beneath the horizontal obstacle at $2,388. Securing a daily close beyond this threshold would bring $2,746 and subsequently $3,411 into realistic targeting range.
Large Holder Distribution Creates Headwinds
Blockchain analytics reveal that addresses containing 10K–100K ETH initiated selling operations once prices surpassed their average acquisition cost. These substantial holders have unloaded approximately 60K ETH since the beginning of the week.

Additional cohorts holding between 100–1K and 1K–10K ETH have collectively distributed roughly 350K ETH across the weekly period. Such distribution patterns typically reflect holders seeking exits near their cost basis.
Open interest in ETH futures contracts has plateaued around 14.2 million ETH following the initial price surge earlier this week. The seven-day moving average for the Taker Buy-Sell Ratio demonstrates declining trends, indicating waning enthusiasm among derivative market participants.
Liquidation events totaling $111.6 million occurred across the past 24-hour period. Long position liquidations accounted for $70.8 million of this total.
ETF Capital Flows Provide Counterbalance
Spot Ethereum ETF products in United States markets documented five consecutive sessions of positive net flows. Wednesday’s session alone captured $67.8 million in fresh capital, based on SoSoValue tracking. This indicates measured institutional participation returning to the market, though analysts characterize the momentum as gradual.
The 4-hour chart configuration displays ETH experiencing rejection at the $2,360 resistance cluster before retracing toward $2,190 support territory. Should buyers successfully defend this foundation, another challenge of the $2,400 region becomes feasible.
ETH presently trades at $2,350, sustaining position above near-term moving averages, with $2,360 representing the immediate barrier requiring penetration.