
 Price Surges Past $2,080: Critical Breakout Zones Ahead")
Key Takeaways
- Ethereum has surged past the $2,080 threshold with attention focused on the $2,150 barrier
- The $2,000 mark represents crucial support — a breach could spark significant long position liquidations
- Successfully breaking through $2,150–$2,180 may pave the way toward $2,220–$2,350
- Historical chart analysis reveals an ascending channel pattern extending from 2022
- Technical analyst Ali Charts identifies $1,551 and $1,070 as critical lower support zones if the channel fails
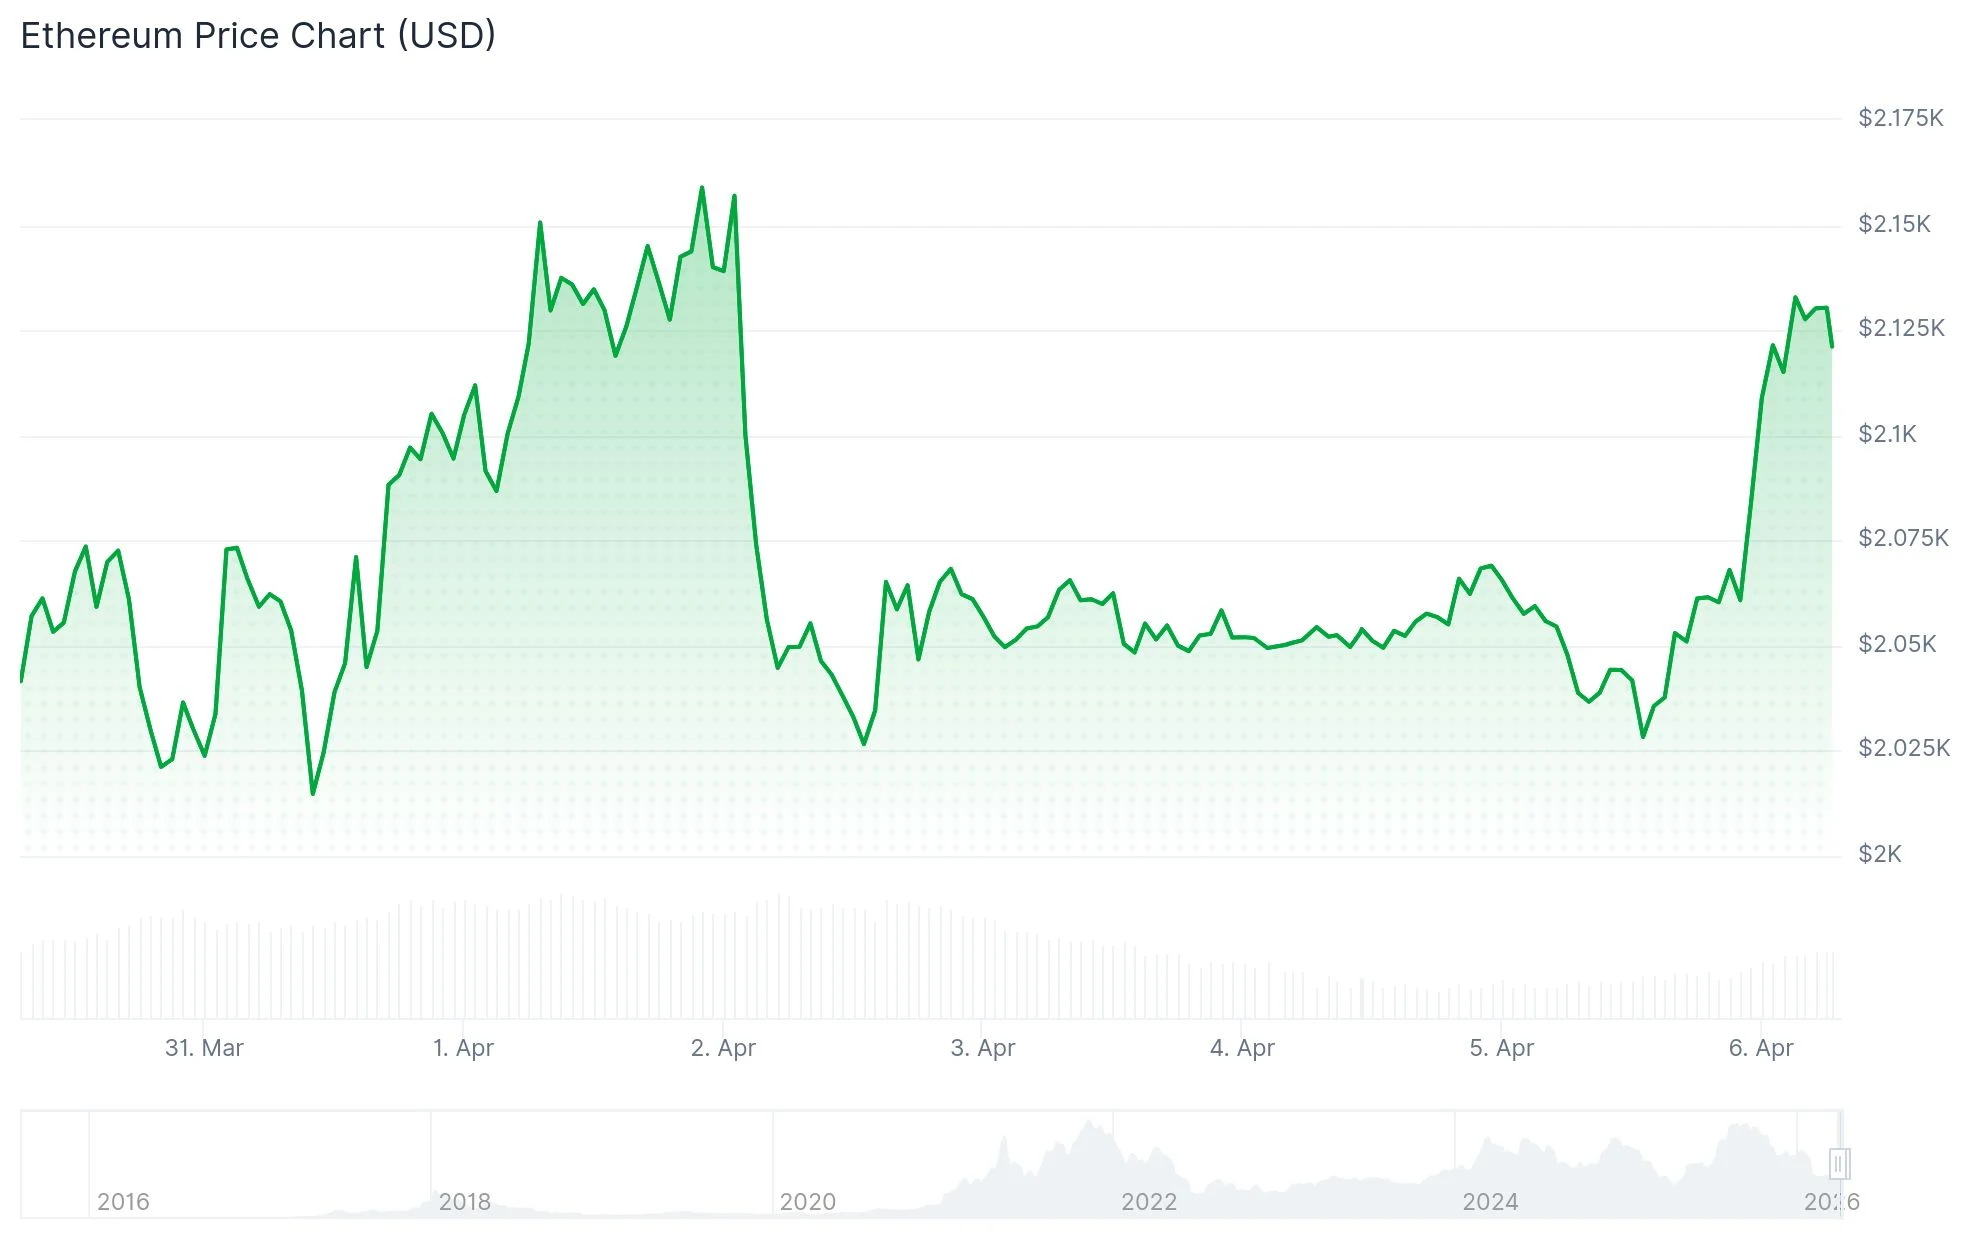
Ethereum has climbed beyond the $2,080 mark following a bounce from lows around $2,017. The digital asset pushed through a significant downtrend line at $2,065 on the 60-minute timeframe and currently trades above its 100-hour Simple Moving Average.
This upward movement carried ETH beyond the 50% Fibonacci retracement point calculated from the $2,168 peak down to the $2,017 bottom. The asset now approaches the 83.2% Fibonacci level around $2,140, which aligns with the primary resistance area.
Traders are currently monitoring $2,150 as the pivotal level. This zone has generated multiple price reactions, establishing it as a significant near-term obstacle. Bulls require a decisive push above this threshold to sustain upward momentum.
Should ETH successfully breach $2,150, the subsequent resistance emerges at $2,180. Clearing that hurdle could bring $2,220 into focus, with $2,350 and $2,380 representing extended upside objectives.
Downside Risk if Ethereum Stalls at $2,150
Should price action falter at $2,150, the first support level appears at $2,080, with $2,065 providing additional backing. Falling below $2,065 might drive ETH back toward $2,020, while $1,980 and $1,965 serve as deeper support benchmarks.
Trader Ted highlighted the $2,000 zone as particularly critical. Dropping beneath this psychological level could unleash a substantial liquidation cascade, given the concentration of leveraged long positions clustered around this price point. Such forced selling pressure might accelerate downward movement toward $1,755 or potentially $1,693.
The near-term trading range appears clearly established. Ethereum is either constructing a foundation for a breakout beyond $2,150 or faces downside risk if the $2,000 support crumbles.
Broader Technical Picture Remains Constructive
From a macro perspective, technical analyst James Easton UK published a chart illustrating Ethereum trading within an expansive ascending channel dating back to 2022. The lower trendline has maintained its integrity through multiple significant corrections, with demand consistently emerging near this support zone.
The upper channel boundary has likewise been tested during stronger bullish phases, forming a broad pattern where substantial retracements haven’t invalidated the overarching uptrend. This structure continues to hold validity provided the rising support line remains unbroken.
Analyst Ali Charts noted on X that within this channel framework, $1,551 and $1,070 represent the essential support benchmarks to watch beneath current valuations.
As of April 6, 2026, Ethereum shows a 0.55% gain and trades above $2,080, with the $2,150 resistance zone serving as the immediate challenge for bullish participants.