
 Hovers at Critical Support — Will It Hold or Break?")
Key Highlights
- Ethereum currently hovers around $2,181, with a critical support zone between $2,150 and $2,200 being tested.
- Breaking below $2,150 could trigger a move toward the psychologically important $2,000 level.
- RSI reads 53.53, while ETH trades above 20-day and 50-day moving averages but remains under 100-day and 200-day averages.
- Analyst Ali Charts highlights weekly support zones at $1,550 and $1,070 if the current range fails to hold.
- Holding current support could enable a move toward $2,400, with $2,624 representing the next resistance beyond that point.
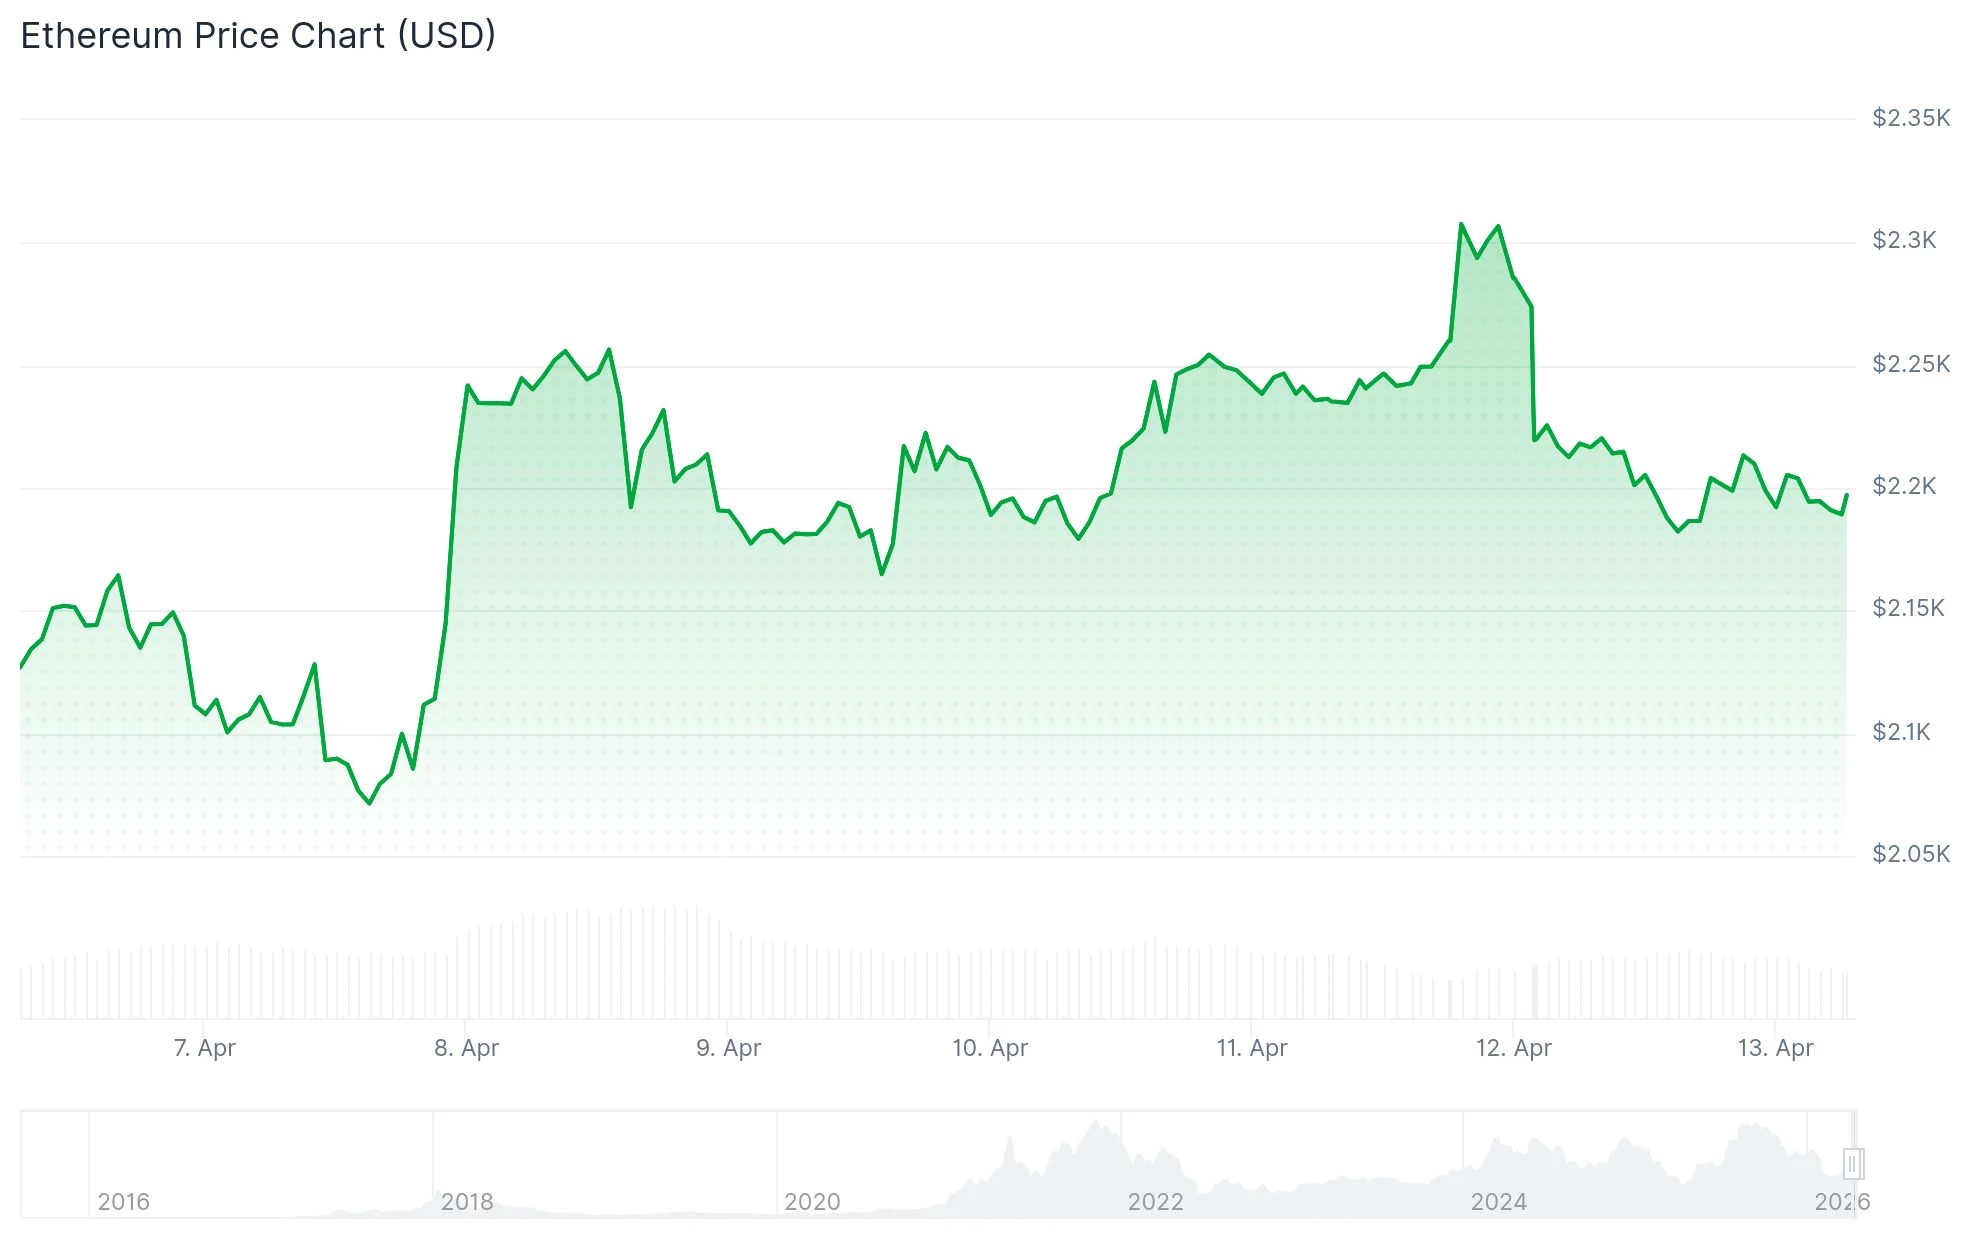
Ethereum has reached a critical juncture that market participants are monitoring with heightened attention. Currently, ETH is changing hands at $2,181.19, reflecting a 2.89% decline over the last day. The asset has registered $28.19 billion in trading volume, while maintaining a market capitalization of $263.38 billion.
Market focus has zeroed in on the $2,150–$2,200 range. Analyst Ted highlighted on X that Ethereum momentarily approached a drop beneath the $2,200 mark, influenced by broader risk-averse sentiment sweeping through international markets. According to Ted, this zone represents a critical battleground where buying interest is expected to emerge.
Should ETH maintain its position above $2,150, the near-term trajectory suggests consolidation followed by a potential advance toward $2,400. This level serves as the primary resistance barrier. Following that, charting analysis identifies approximately $2,624 as the subsequent upside objective.
Conversely, a failure to defend the $2,150 threshold would likely direct attention toward $2,000 — a significant round-figure level that has historically provided psychological support.
Technical Readings Present Neutral-to-Bullish Signals
From a technical perspective, the Relative Strength Index stands at 53.53, marginally above its average of 53.40. This measurement suggests a mildly bullish tilt without displaying decisive momentum in either direction.
ETH maintains positioning above its 20-day simple moving average ($2,117.30) and 50-day SMA ($2,080.00), indicating that short-term support structures remain intact. Nevertheless, price action continues below both the 100-day SMA at $2,360.14 and the 200-day SMA at $2,918.05. This configuration suggests the longer-term trend remains under pressure.
The MACD line currently trades marginally above its signal line, potentially signaling early stabilization. However, market analysts emphasize that additional buying momentum is necessary before confirming a sustained recovery trajectory.
Longer-Term Chart Reveals Deeper Support at $1,550 and $1,070
Analyst Ali Charts shared a weekly Ethereum chart on X suggesting the asset may continue trading within a parallel channel formation. The analysis identifies two significant downside levels: $1,550 and $1,070.
These price points aren’t arbitrary — both correspond with historical reaction zones visible on the weekly timeframe. The $1,550 level would represent the initial major support floor should current levels fail to hold. Below that threshold, $1,070 emerges as the deeper support target.
Daily chart analysis further indicates that losing the $2,155 area would likely direct ETH toward approximately $2,015. A breach of that level would bring $1,775 into focus as an additional support zone.
As of April 13, 2026, Ethereum trades at $2,181.19, with the $2,150 level serving as the pivotal line determining near-term price direction.