
 Plunges Below $600 as Global Tensions and Oil Surge Shake Crypto Markets")
Key Takeaways
- Binance Coin declined more than 5%, breaching the critical $600 psychological threshold
- Crude oil prices jumped beyond $110 amid escalating Middle Eastern geopolitical tensions, creating pressure across cryptocurrency markets
- Technical indicators reveal three consecutive bearish signals on 4-hour timeframes, indicating institutional liquidation
- Further downside movement toward $520 remains likely under sustained selling pressure
- Daily RSI indicators have declined beneath 40, reinforcing negative market sentiment
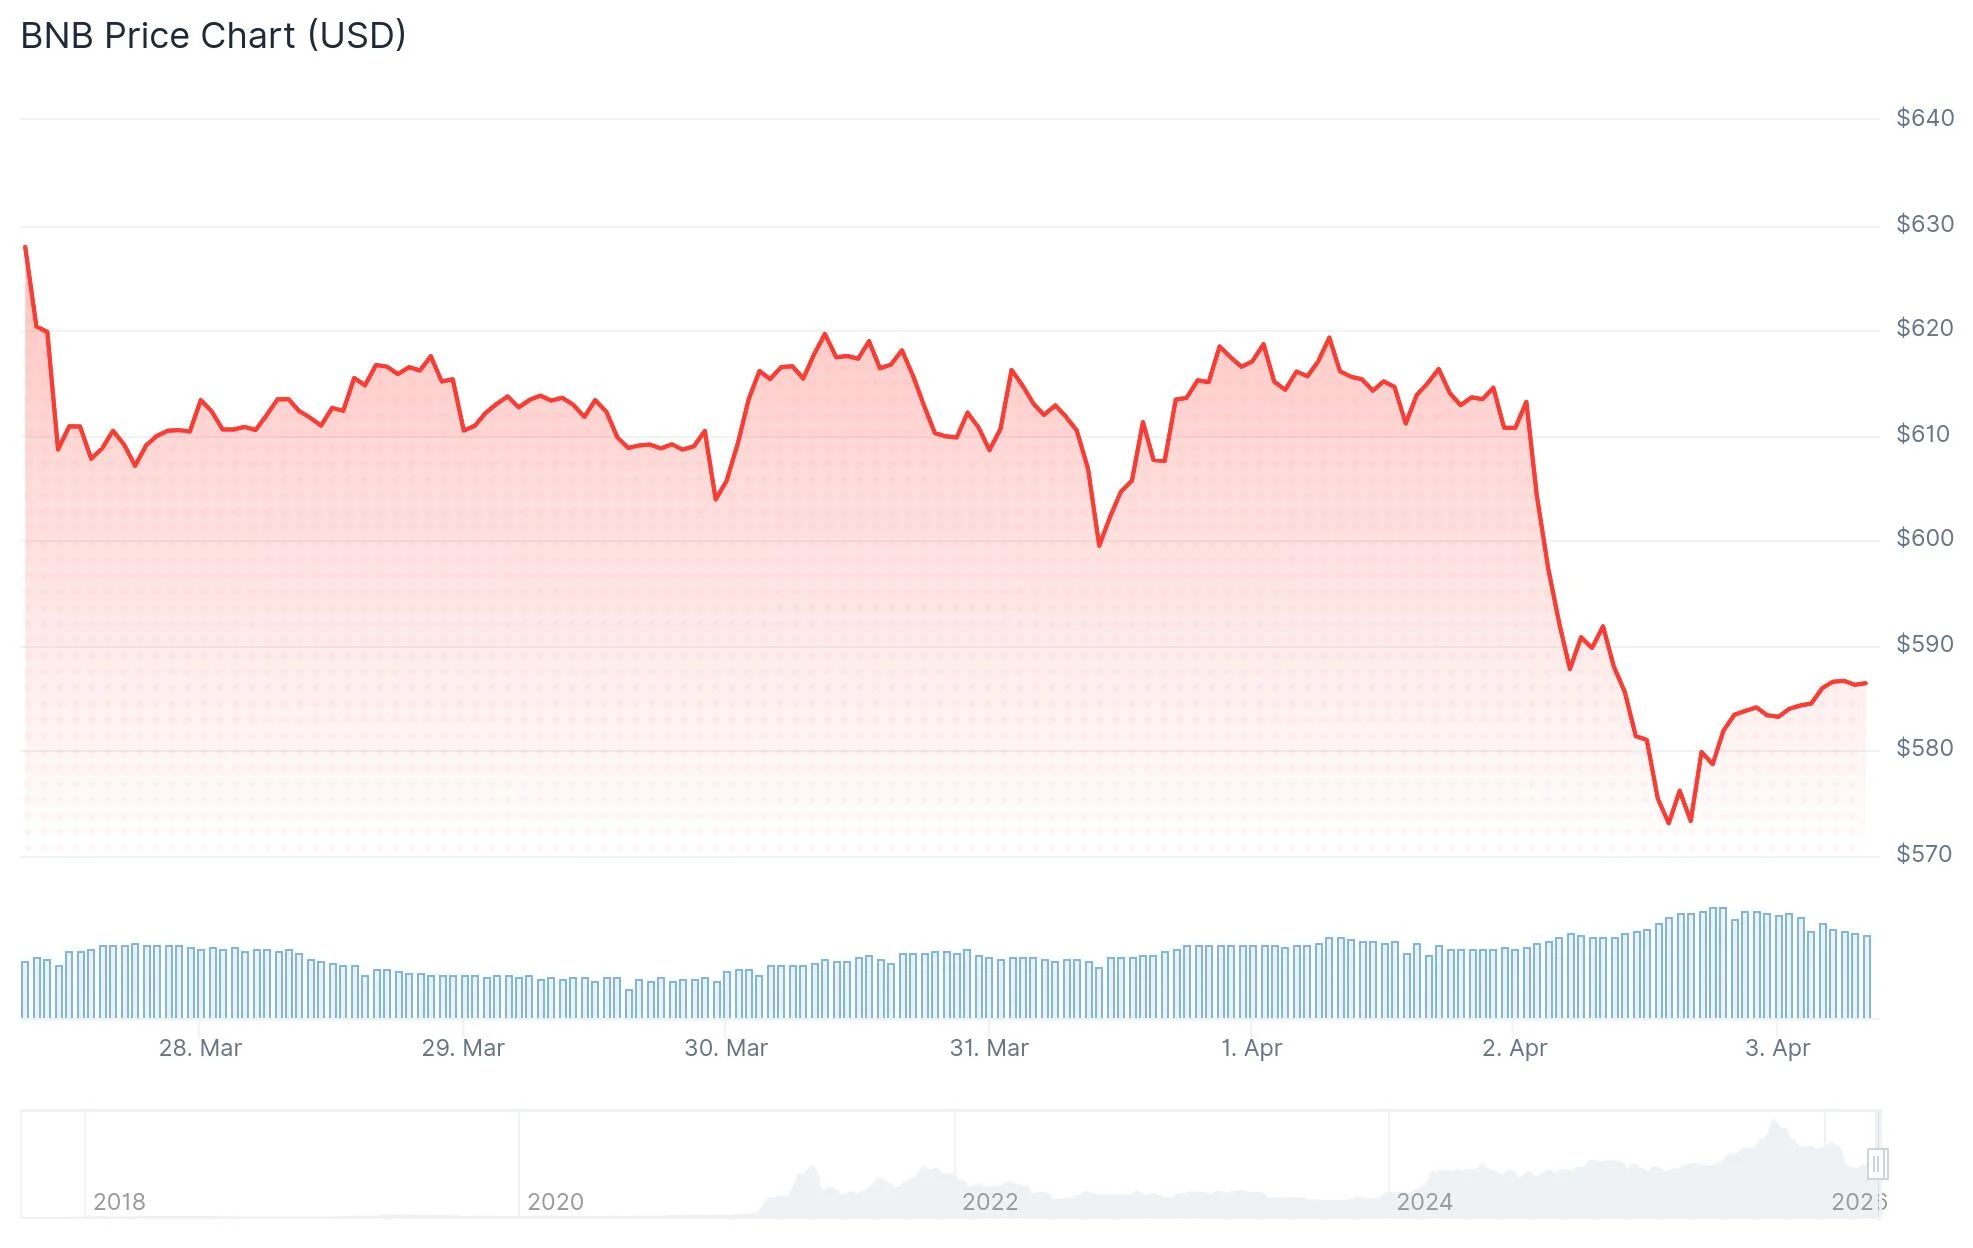
Binance Coin has experienced a sharp decline exceeding 5% during the latest trading session, falling through the closely monitored $600 price threshold. The digital asset momentarily reached $580 before stabilizing at temporary support levels.
The widespread selloff coincides with crude oil markets surging past the $110 per barrel mark. Heightened tensions emerged after President Trump issued military threats against Iran concerning Strait of Hormuz access, creating turbulence throughout global financial markets and driving capital away from risk-oriented assets including cryptocurrencies.
Binance Coin’s trading activity increased by 35% over the preceding 24-hour period as the asset challenged the $580 demand region.
Currently trading at $580, BNB sits 57% beneath its recent peak of $1,360. This substantial valuation difference underscores the considerable selling momentum accumulated throughout recent months.
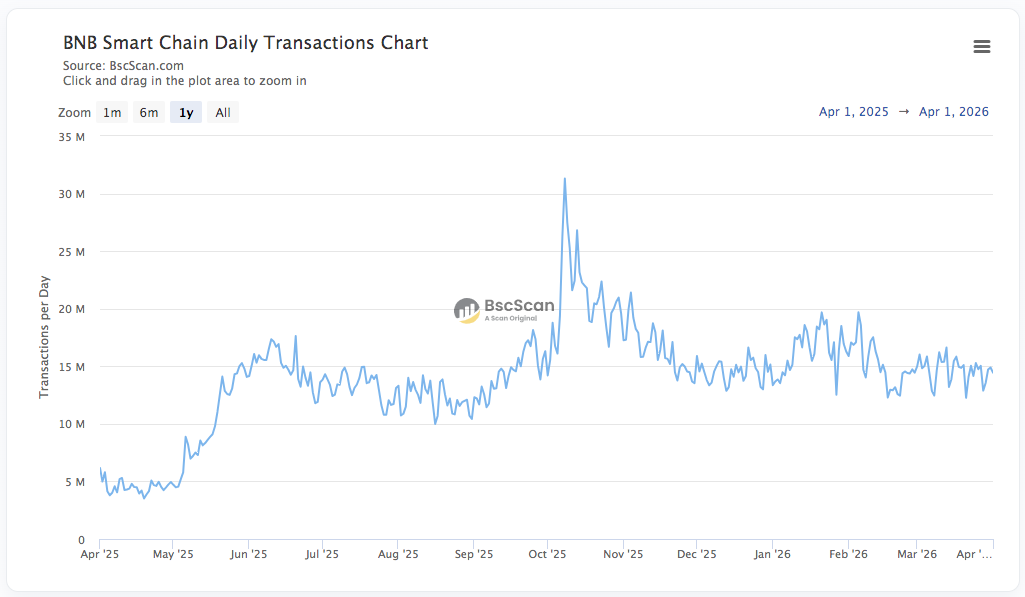
Binance Coin serves dual primary functions: providing fee reductions on the Binance exchange platform and facilitating transaction payments across the BNB Chain network. Blockchain analytics from BSC Scan indicate daily transaction volumes fluctuating between 13 and 19 million operations, maintaining typical activity ranges.
Bearish Momentum Dominates Price Action
Daily chart analysis reveals BNB has revisited the $580 price level three separate times within a two-month period. This repeated testing of identical support zones diminishes confidence in imminent bullish reversals.
The daily Relative Strength Index has fallen beneath the 40 threshold, a technical development that market analysts interpret as a bearish indicator.
Federal Reserve policy expectations compound downward pressure. Market analysts have eliminated projections for rate reductions throughout 2026. Just one month prior, approximately 47% of forecasters anticipated a June rate cut.
Multiple Bearish Indicators Emerge Since Mid-March
Four-hour chart patterns display three sequential sell signals emerging since March 18. The latest indicator materialized following the conclusion of U.S. trading hours on April 2.
These technical formations suggest institutional participants are actively liquidating positions. The 4-hour RSI has entered oversold conditions, potentially setting up a brief corrective bounce.
Any resulting upward correction might present short-position traders with improved entry opportunities ahead of a possible descent toward $520.
Market analyst Crypto Patel shared on X that BNB penetrated below $570 for the initial time in more than twelve months. Patel highlighted the $400–$500 range as a significant accumulation territory based on Fibonacci retracement levels at 0.5 and 0.618, referencing historical price pattern behavior.
Binance Coin currently competes closely with XRP and USDC for fifth position in overall cryptocurrency market capitalization rankings, trailing XRP by merely $1 billion.
The Fear & Greed Index registers at 9, signaling extreme fear sentiment pervading the broader cryptocurrency marketplace.