
 Surges Past $76K: How Ceasefire Optimism and Short Squeeze Dynamics Are Reshaping the Market")
Key Takeaways
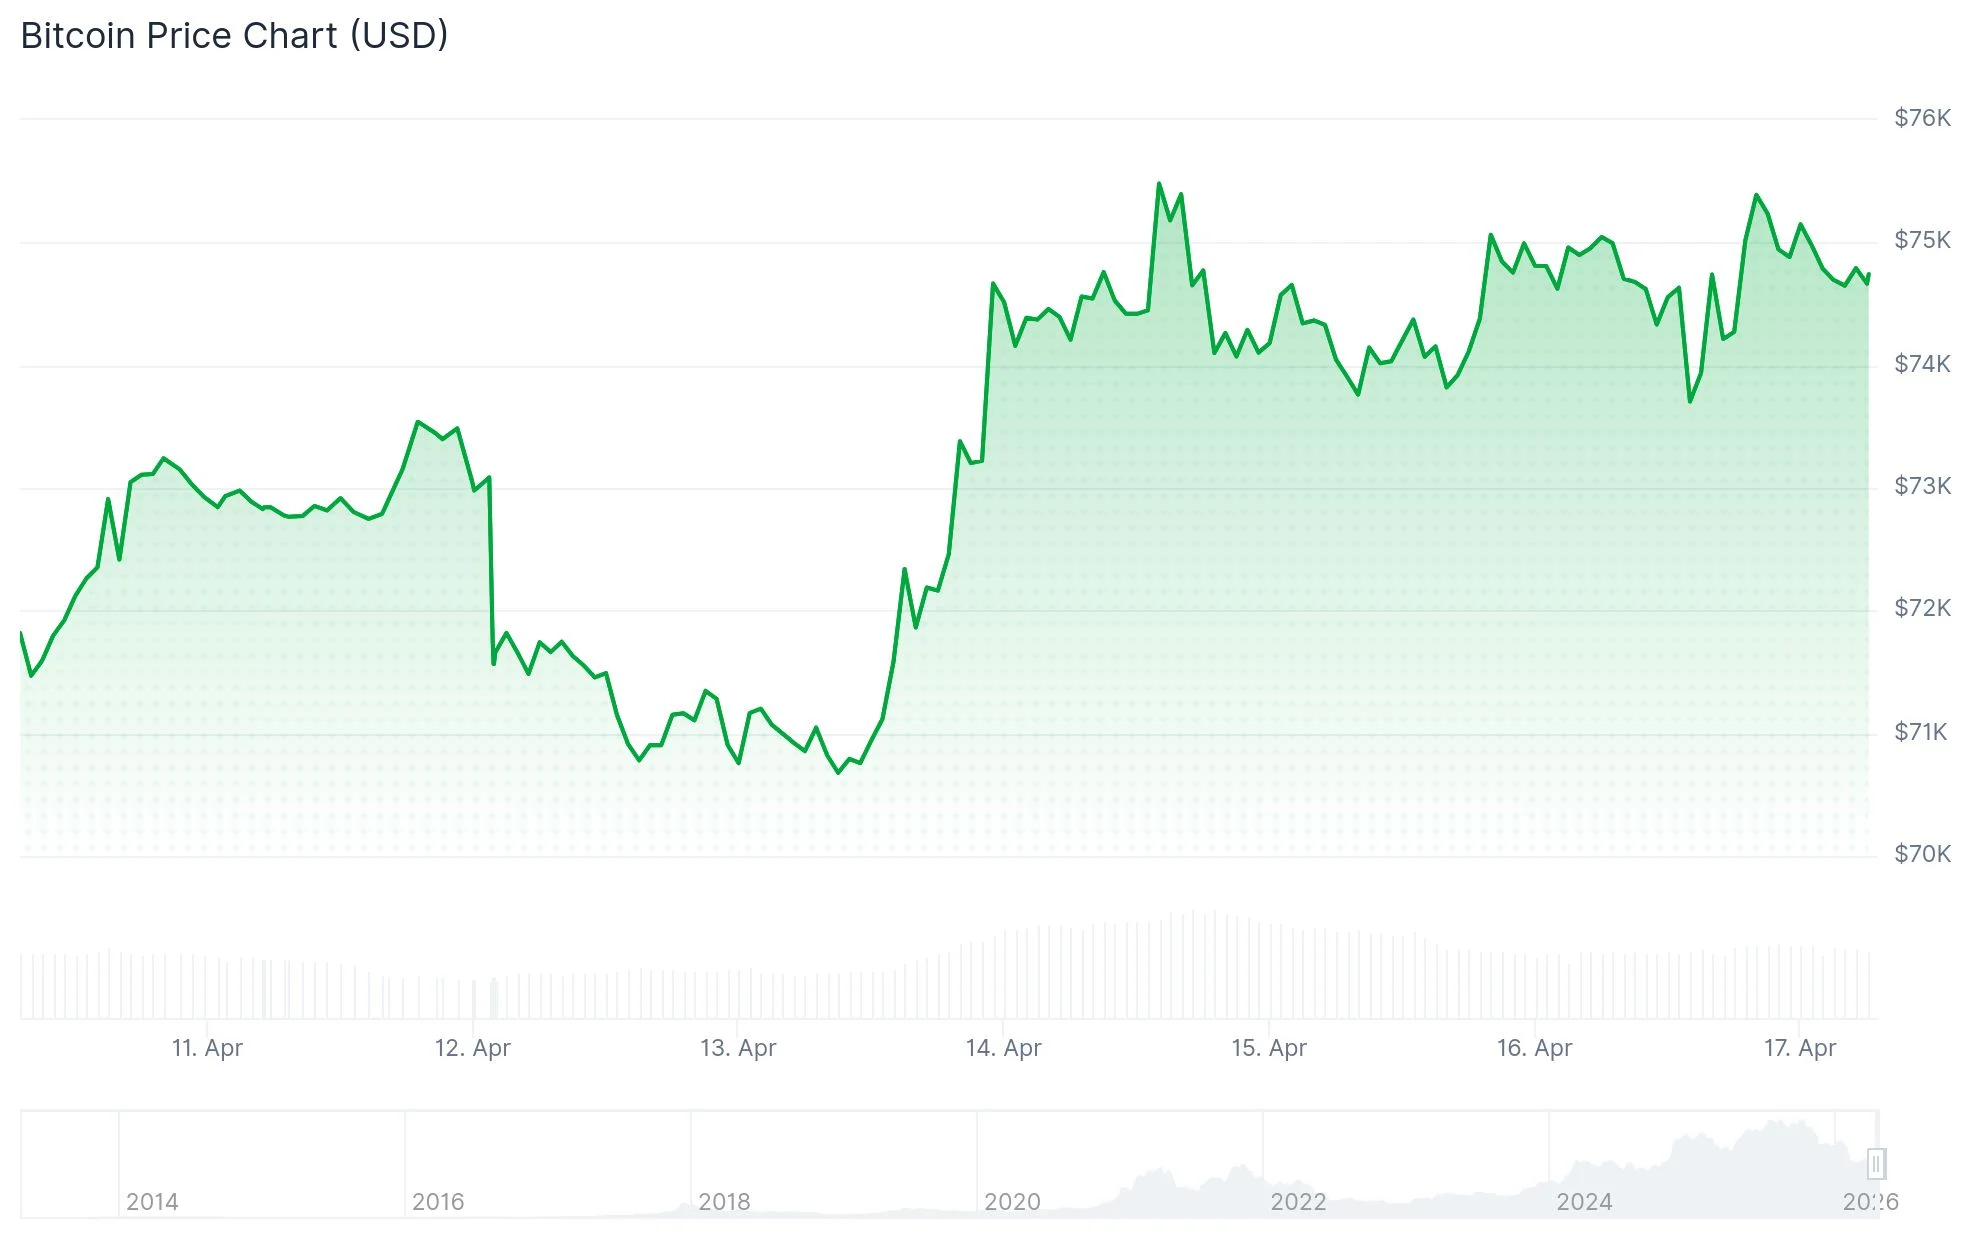
- Bitcoin surged to approximately $76,000 this week, marking its strongest performance in several months, fueled by diplomatic progress between the United States and Iran.
- President Trump’s announcement of a 10-day Israel-Lebanon truce provided additional momentum, temporarily lifting BTC toward the $75,000 threshold.
- Technical analysts emphasize that BTC requires a decisive weekly close above $76,000 to validate a genuine trend reversal, with subsequent price targets ranging from $84,000 to $96,000.
- Perpetual futures funding rates have plunged into deeply negative territory, indicating overwhelming short positioning that creates conditions for a potential rapid squeeze.
- Bitcoin spot ETFs recorded $451 million in net inflows on Tuesday, though sustained daily capital flows will be essential for maintaining upward momentum.
Bitcoin has captured significant attention throughout the week, reaching a multi-month peak near $76,000 before moderating to approximately $74,700 by Friday morning Asian trading hours. The upward trajectory reflects improved geopolitical circumstances and rekindled institutional appetite.
The driving force behind this advance has been growing confidence surrounding the U.S.-Iran diplomatic agreement, which has influenced pricing across various risk-sensitive asset classes. President Trump’s concurrent announcement of a 10-day ceasefire arrangement between Israel and Lebanon further elevated market sentiment. Bitcoin’s intraday price action reflected this optimism, climbing from approximately $73,000 to $74,800 immediately following Trump’s statement.
According to Polymarket data, traders are assigning an 87% likelihood that the U.S.-Iran ceasefire will be prolonged beyond its scheduled April 21 expiration date. Pakistani diplomatic sources quoted by Al Jazeera indicated a “major breakthrough” regarding negotiations over Iran’s nuclear capabilities, which had represented the most significant obstacle during initial discussions.
Global equity markets participated in the upward movement, with the MSCI All Country World Index recording a new all-time high on Thursday. The S&P 500 similarly achieved a fresh record. This broader risk-on environment provided support across cryptocurrency markets, with Ether advancing 6% over the week, XRP climbing 6.4%, and Dogecoin gaining 5.6%.
Critical Levels According to Market Experts
Analyst Crypto Patel characterized “$76K as the level that decides everything,” explaining that a higher-timeframe candle closure above this threshold would unlock pathways toward the $84,000–$96,000 territory. Glassnode data indicates more than 2 million BTC were accumulated within that price zone throughout the past six months.
Material Indicators, a trading analytics platform, identified multiple technical resistance layers, including the yearly open at $87,500 and the 50-week moving average positioned at $97,000. Analyst Rekt Capital emphasized that BTC must achieve a weekly close above $72,800 simply to “confirm a breakout.”
The bull score index, which evaluates comprehensive Bitcoin market strength, climbed to 40 on April 15 — representing its highest measurement since late October 2025. CryptoQuant analyst Arab Chain observed that the index remains within neutral parameters and must exceed 60 to indicate robust bullish momentum.
Conditions Favoring a Short Squeeze
Bitcoin perpetual futures funding rates have descended into significantly negative territory during recent trading sessions, reaching depths not observed since 2023. Negative funding occurs when short sellers compensate long position holders — a clear indication that market participants are heavily positioned for downside.
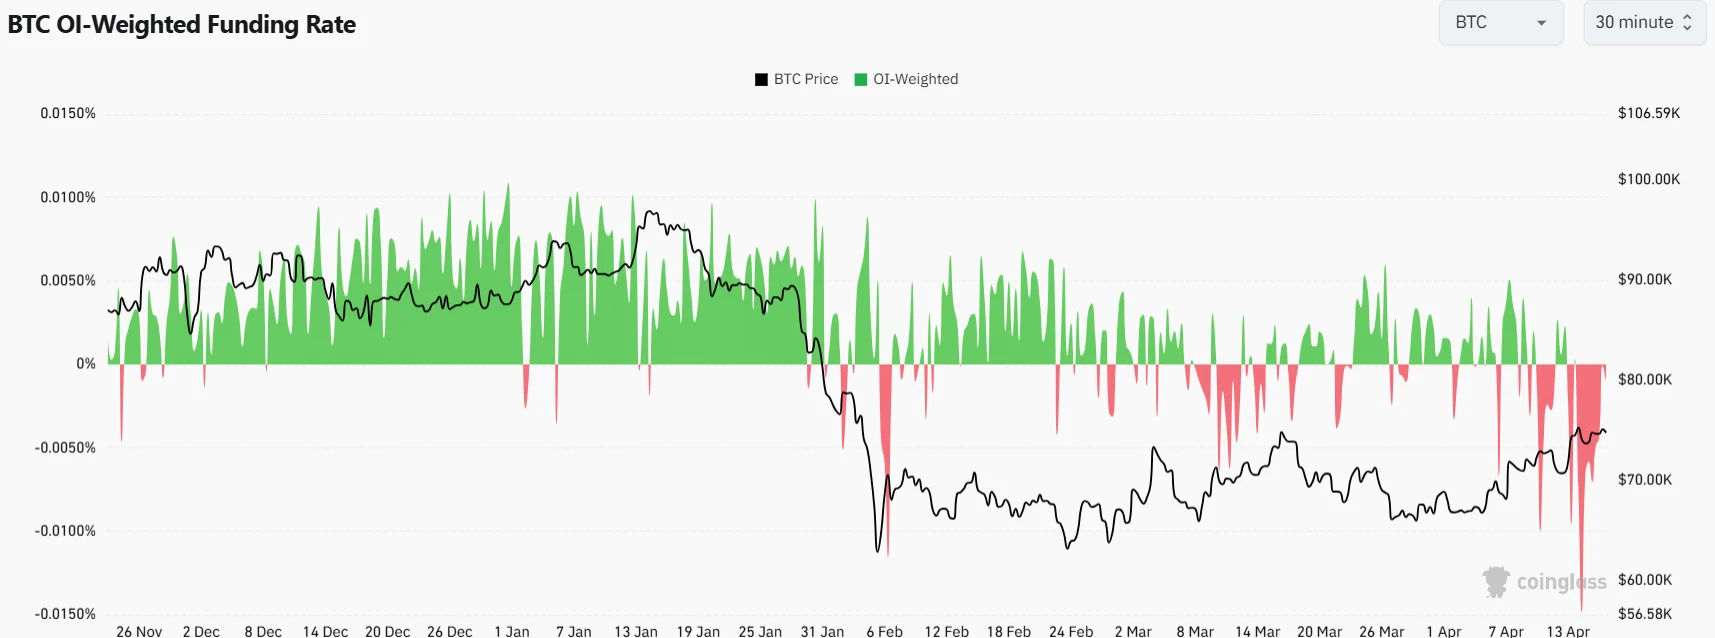
Daniel Reis-Faria, CEO of ZeroStack, explained to CoinDesk: “Funding rates this negative tell you the market is heavily short. If Bitcoin continues to move higher despite that, a lot of those positions could get liquidated, and the move can accelerate quickly.” Reis-Faria projected BTC could potentially reach $125,000 within the next 30 to 60 days should short positions face forced liquidation.
On-chain analyst CryptoVizArt presented an alternative perspective, observing that Bitcoin’s “True Market Mean” indicates the average active holder is presently holding unrealized losses. Historical analysis shows that prolonged periods trading beneath this metric have aligned with Bitcoin’s most severe price declines.
Spot Bitcoin ETF activity shows mixed patterns, with $451 million in net inflows documented on Tuesday. Bitcoin’s daily transaction volume recently reached 17-month peaks.