

Key Takeaways
- XRP maintains position between $1.36 and $1.39, supported by the $1.33 level
- Technical analysts identify symmetrical triangle formation with $2.06 upside target
- Investment products tracking XRP experienced $30 million in withdrawals during the previous week
- XRPL stablecoin holdings climbed 2.5% to reach $426 million in seven-day period
- Critical resistance zone identified at $1.42, with additional barriers at $1.53 and $1.75–$1.80
As of March 10, 2026, XRP is changing hands around $1.37 after rebounding from a local bottom at $1.34. The digital asset experienced an almost 8% decline from its weekly peak of $1.46 before staging a recovery.
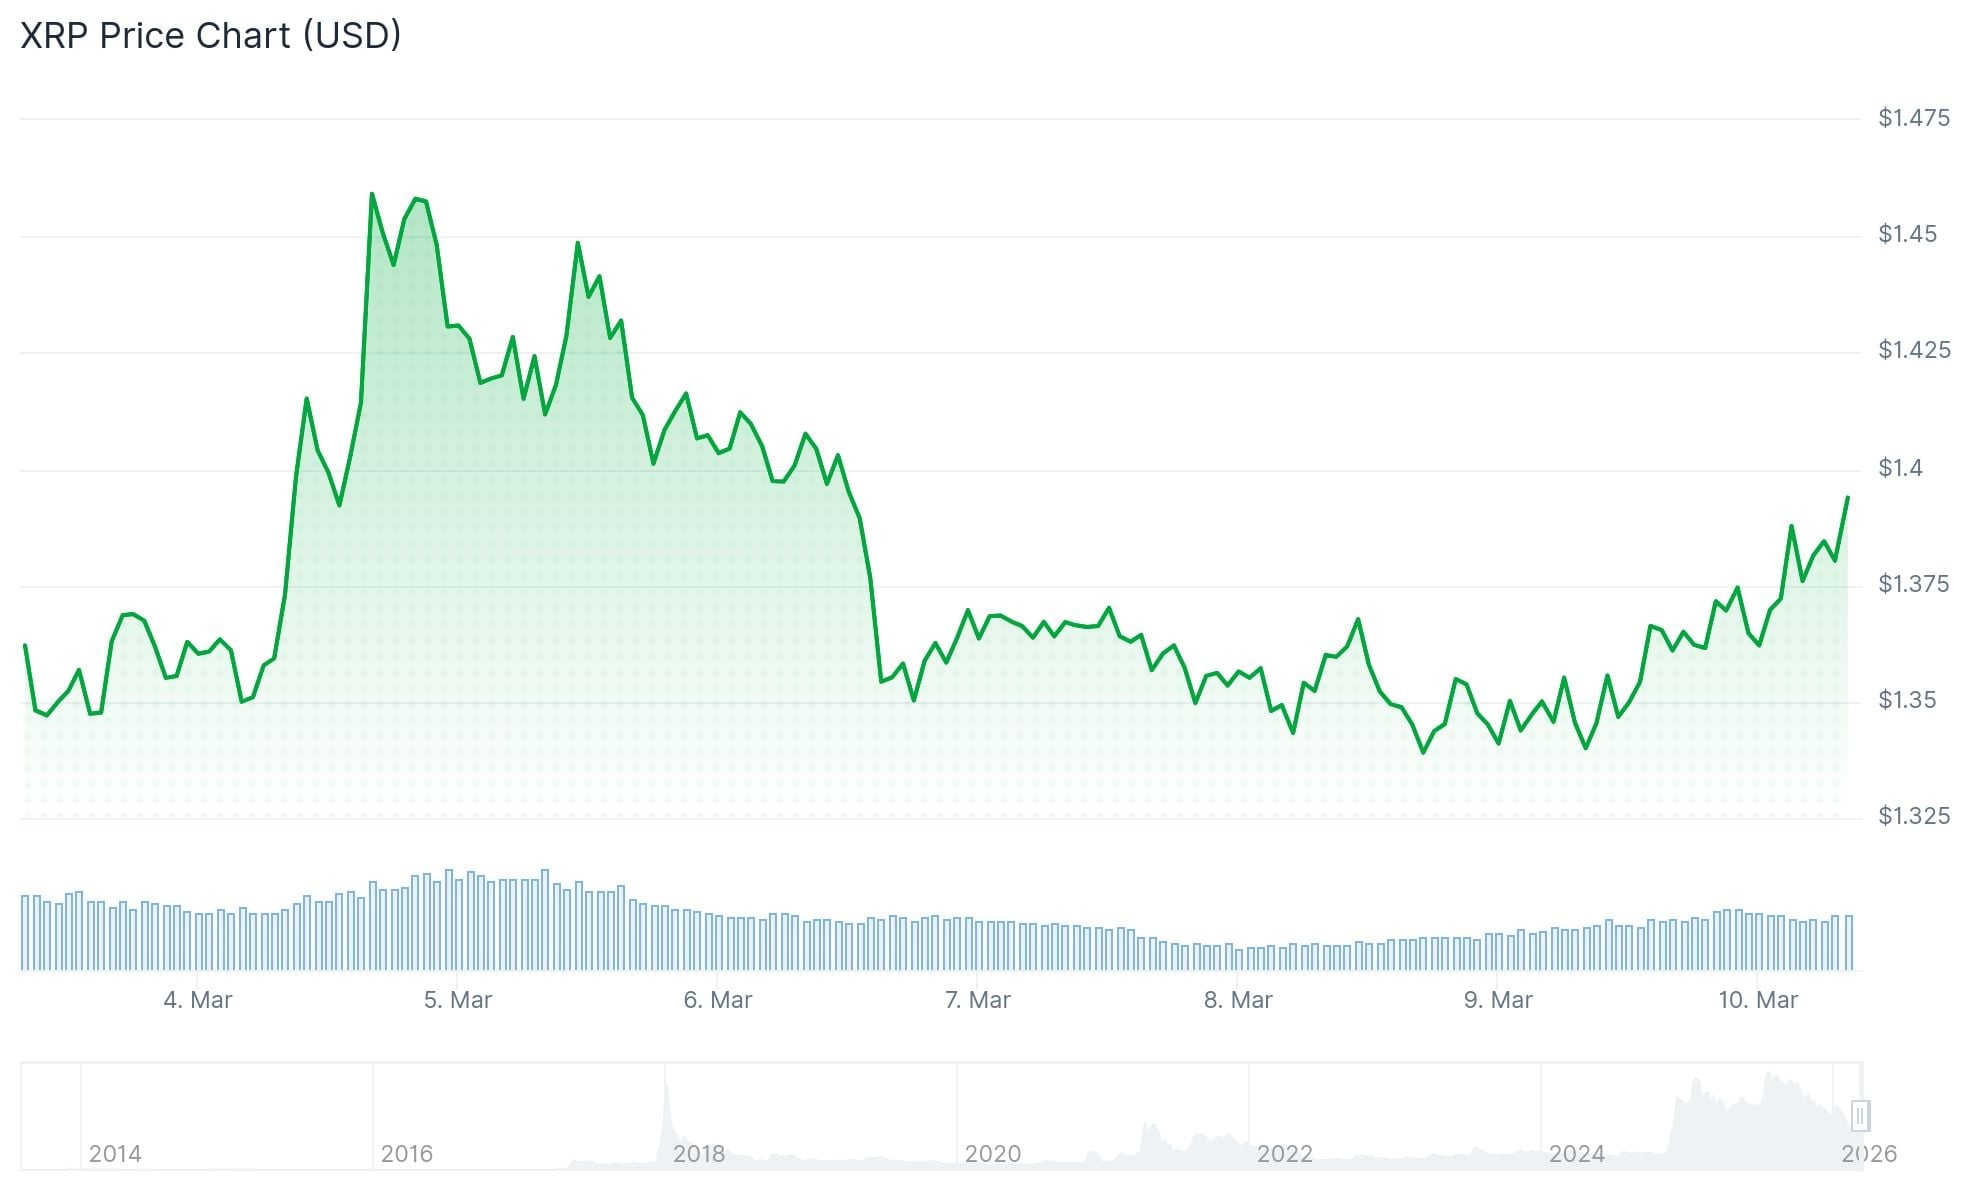
The pullback occurred alongside Bitcoin’s retreat, triggered by inflation worries and escalating geopolitical tensions across the Middle East region. During Asian market hours on March 10, XRP managed to climb nearly 4%, reaching an intraday peak of $1.39.
Since recording its all-time high of $3.66 in July, XRP has entered a corrective period. Weekly chart analysis reveals a pattern of declining peaks and valleys, indicating near-term downward momentum.
However, the diminishing size of recent candlesticks suggests the market is entering a consolidation phase rather than experiencing sustained selling pressure.
Technical Formation Indicates Potential Breakout Scenario
Chart analysis on the daily timeframe reveals XRP is developing a symmetrical triangle configuration. This technical pattern emerges when price action compresses between two converging trendlines that connect successive highs and lows.
A decisive move above the triangle’s upper boundary would represent a bullish development. Market observers are closely monitoring the 23.6% Fibonacci retracement level at $1.42, which represents the initial resistance barrier that must be overcome.
Should XRP successfully breach the $1.42 threshold, the triangle pattern’s measured move projects a price objective around $2.06. This would represent approximately a 50% increase from present levels.
The MACD momentum indicator is trending higher, while the RSI has created a bullish divergence against recent price movement. These technical signals indicate diminishing downward pressure.
On March 9, analyst JD highlighted that XRP continues to respect a long-term ascending trendline established during early accumulation phases below $0.01. Historical data shows that each test of this trendline has attracted strong buying interest.
The $3.30–$3.50 zone represents a more significant obstacle for any sustained upward movement. Market participants interpret this area as either an ascending triangle resistance or a rising wedge formation.
Capital Flows and Blockchain Metrics
Investment vehicles tracking XRP recorded $30 million in capital withdrawals during the past week, based on CoinShares data. These products currently manage approximately $2.4 billion in total assets, with year-to-date inflows maintaining a positive $123 million.
Spot XRP exchange-traded funds in the United States registered $22 million in net redemptions across the most recent two-week period, breaking a four-week streak of positive flows.
Futures Open Interest currently stands at $2.25 billion, representing a substantial decrease from the July high of $10.94 billion.
Conversely, stablecoin reserves on the XRP Ledger expanded 2.5% during the past week to reach $426 million, per DeFiLlama tracking. Increasing stablecoin presence on a blockchain network generally indicates enhanced liquidity and heightened trading volume.
The nearest support level is positioned at $1.33. A violation of this floor could expose the $1.27 level. For upward movement, traders are watching resistance zones at $1.42, $1.53, and the $1.75–$1.80 range.