

TLDR
- Crypto analyst Ali Martinez spots a multi-year ascending triangle formation on XRP’s monthly timeframe with $8.50 projection
- Critical support level identified between $0.75–$0.80, marked as prime accumulation zone
- Binance’s Taker Buy/Sell ratio reached all-time highs, indicating increased buying activity
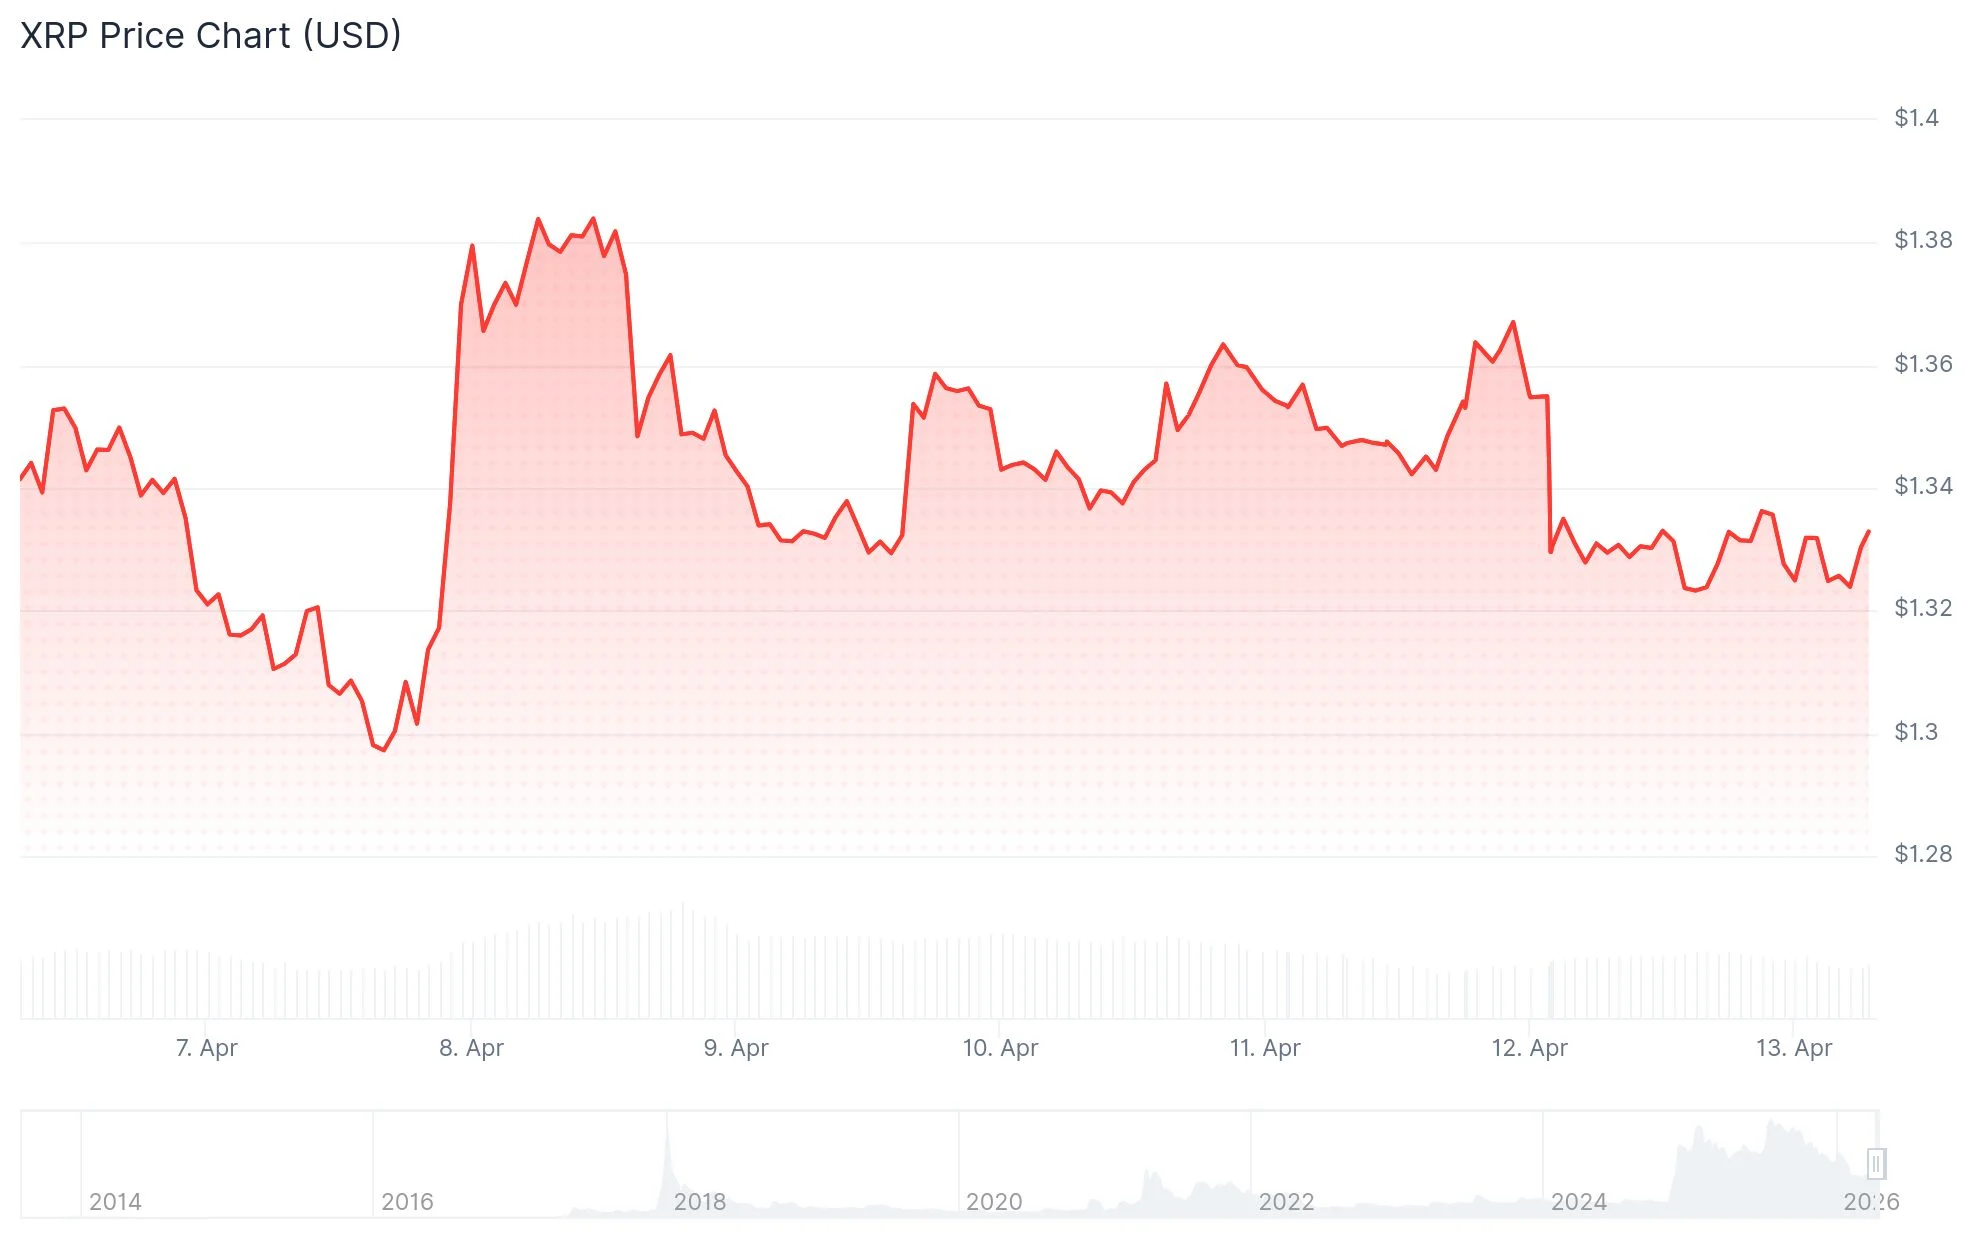
- XRP currently priced near $1.33, experiencing a 1.7% daily decline but showing 2.36% weekly gains
- Futures open interest decreased 1.76% to $2.43 billion, with liquidations totaling $3.98M — predominantly long positions
XRP maintains a position around $1.33 while market observers monitor a long-term technical formation that has developed over nearly a decade. The digital asset remains confined within a tight trading band, awaiting a decisive directional shift.
Market analyst Ali Martinez shared observations on X regarding XRP’s chart structure, noting the development of a substantial ascending triangle formation dating back to 2017. Throughout this period, XRP has consistently encountered rejection at upper resistance levels before retreating to an ascending support trendline. This cyclical behavior has manifested several times.
According to Martinez’s technical analysis, horizontal resistance exists around $3.30, a level where previous upward momentum has historically faltered. The ascending support trendline has steadily climbed throughout the years, with both lines now converging toward their apex — traditionally the point where significant breakouts materialize.
Should a breakout materialize, Martinez projects a price objective of $8.50. This would constitute approximately a 530% advance from present price levels.
Critical Support Territory Between $0.75–$0.80
The latest resistance rejection occurred in August 2025. Following this price action, Martinez identified the $0.75–$0.80 zone as a crucial area for monitoring. He characterized this region as the “ultimate buy the dip opportunity” ahead of the triangle’s convergence point.
Separately, analyst Crypto TXG observed that XRP remains confined within a shorter-duration consolidation pattern spanning $1.61 to $1.82. No decisive directional candles have emerged, and a breach of this range is necessary before any near-term trend shift materializes.
Blockchain Metrics Indicate Escalating Buy-Side Demand
Analyst CryptoOnchain highlighted notable movements in Binance’s Taker Buy/Sell ratio metrics. The 100-day moving average recently achieved an all-time high. The 30-day buyer ratio climbed to 0.495, while the corresponding sell ratio dropped to 0.505.
This dynamic suggests an increasing number of market participants are executing aggressive buy orders, while selling pressure diminishes. The data indicates subtle accumulation occurring beneath the surface.
U.S.-listed spot XRP ETFs recorded $11.5 million in net inflows during the previous week, although several trading sessions showed zero flow activity.
Santiment highlighted that social media negativity surrounding XRP has reached its third-highest concentration in two years. The analytics platform emphasized that historically, when pessimistic sentiment reaches such extremes, price action has frequently reversed course.
Futures open interest contracted 1.76% to $2.43 billion. Liquidation figures revealed $3.98 million eliminated within 24 hours, with $3.35 million derived from long positions — evidence of ongoing near-term pressure facing optimistic traders.