
 Forms Descending Triangle as Analyst Predicts 30% Breakout")
Key Takeaways
- Dogecoin slipped beneath $0.0930, reaching a trough around $0.0903
- Current trading occurs below the 100-hour simple moving average
- 4-hour chart reveals a descending triangle formation
- Crypto analyst Ali Martinez highlights increasing probability of 30% price swing
- MACD indicator shows “Buy” while RSI and Bull Bear Power hold at Neutral
Dogecoin has experienced a retracement following its inability to sustain momentum above the $0.0930 threshold. The cryptocurrency breached several critical support areas, descending to $0.0903 before staging a modest rebound. Currently, DOGE is changing hands beneath $0.0920 and below its 100-hour simple moving average.
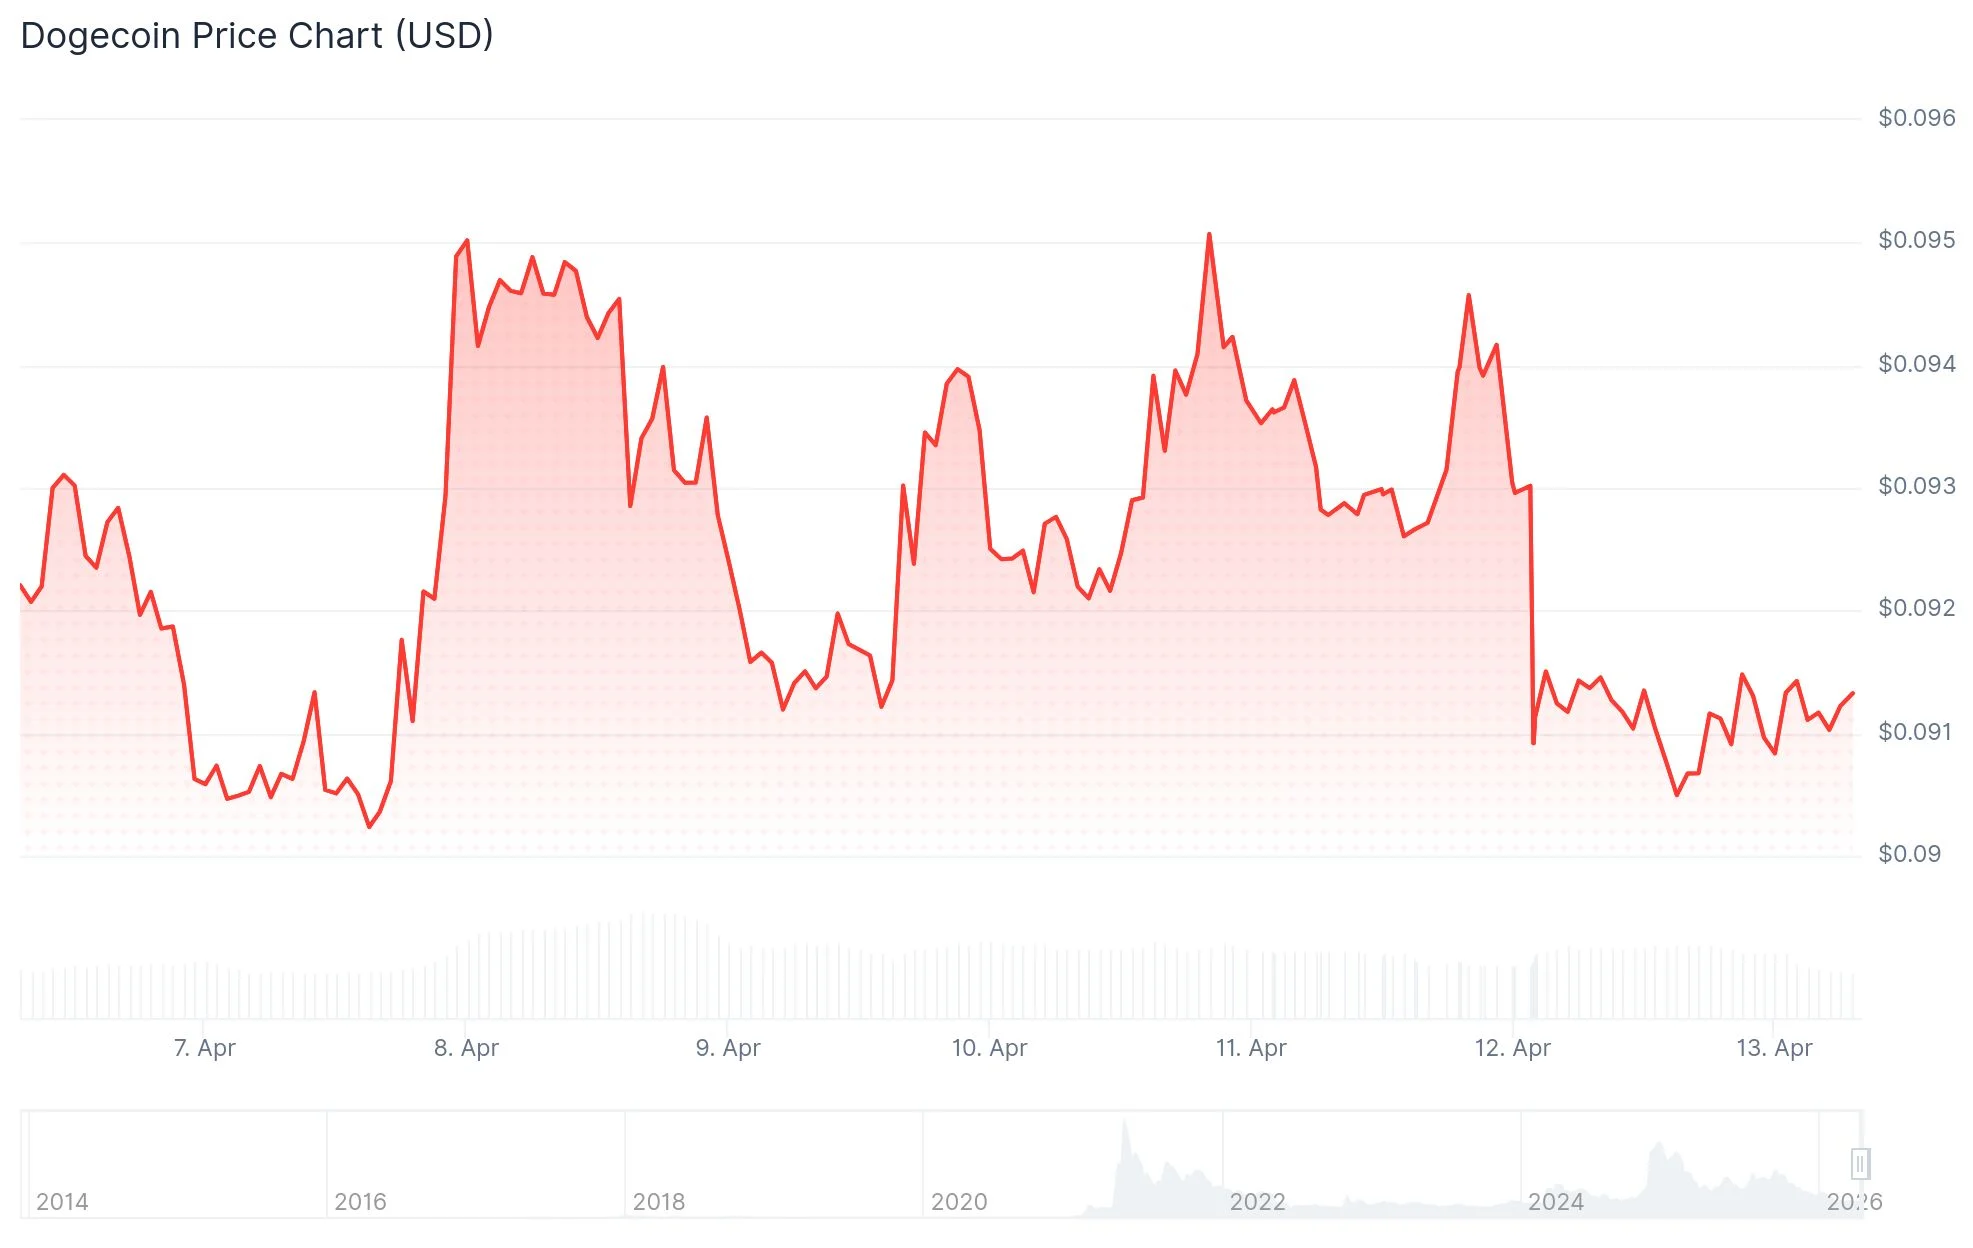
A previously established bullish trendline positioned at $0.0925 was violated on the hourly timeframe, intensifying near-term bearish pressure. The subsequent relief rally encountered resistance below the 23.6% Fibonacci retracement level calculated from the decline between $0.0948 and $0.0903.
Regarding upside targets, initial resistance emerges at $0.0925, coinciding with the 50% Fibonacci retracement of the aforementioned downward movement. Additional obstacles await at $0.0930 and $0.0938. Breaking through these levels could pave the way toward $0.0950, with extended upside reaching $0.0980.
Conversely, immediate support is positioned at $0.0905. Beneath this level lies $0.0900, while the critical support zone rests at $0.0880. A decisive breakdown below $0.0880 could trigger further declines toward $0.0820 or potentially $0.0800.
Technical Analyst Highlights 30% Breakout Scenario
Cryptocurrency technical analyst Ali Martinez shared observations on X on April 12, identifying a descending triangle formation on Dogecoin’s 4-hour chart. Martinez stated: “As Dogecoin $DOGE moves closer to the apex of this triangle, the chances of a 30% move increase substantially.” The analyst refrained from specifying whether the anticipated breakout would occur to the upside or downside. Should the movement materialize upward, a 30% rally would propel DOGE toward $0.11, territory not visited since early February.
Martinez has consistently drawn attention to this pattern formation, referencing the triangle configuration multiple times throughout recent technical assessments.
Derivatives Market and Technical Indicators
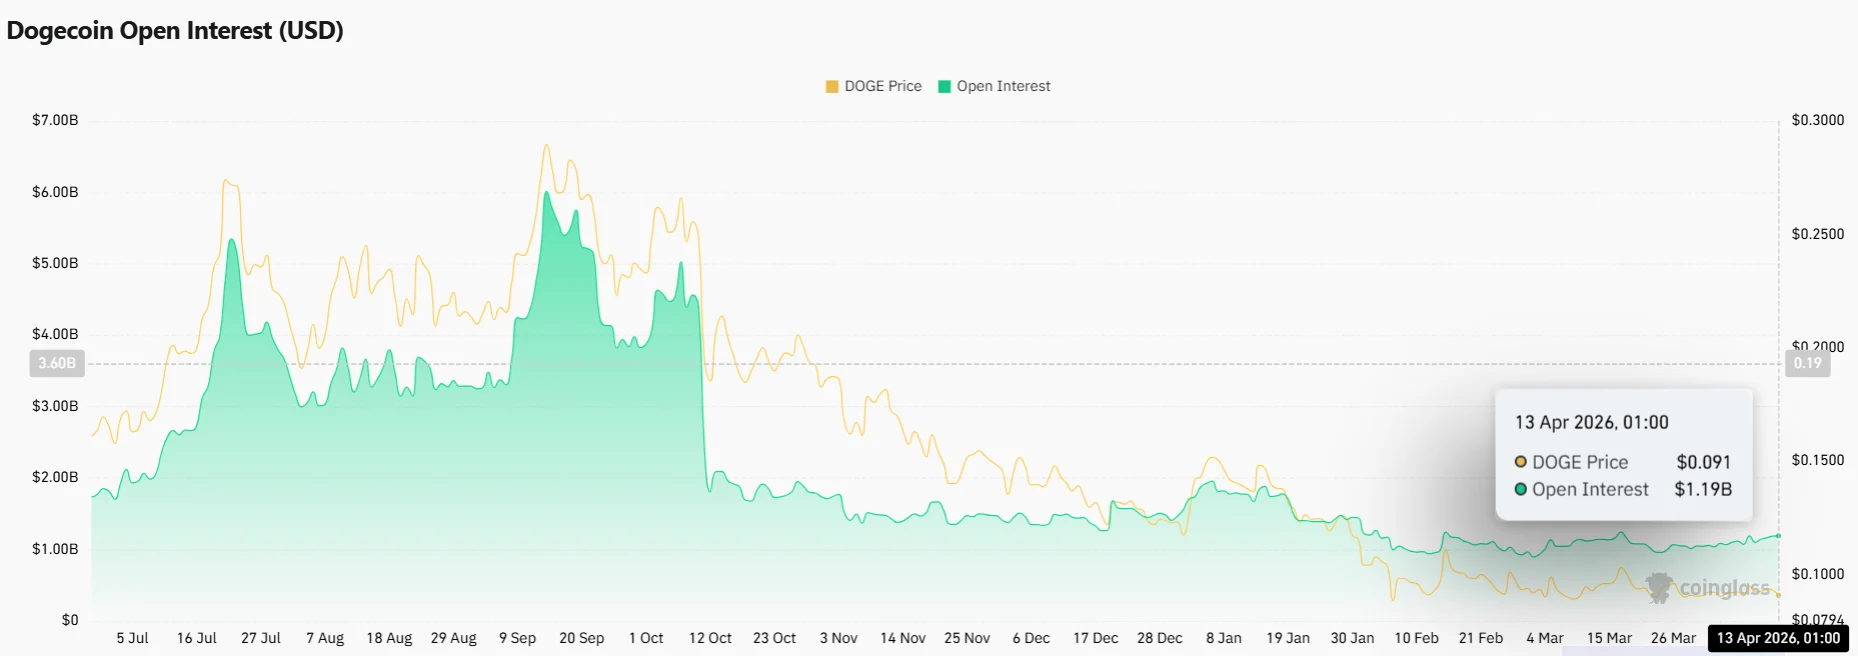
According to Coinglass data, open interest in DOGE futures climbed 1.61% during the previous 24-hour period. An increase in open interest concurrent with lateral price movement typically indicates accumulation preceding a significant directional move.
Large-position traders within the derivatives market maintained bullish positioning. Meanwhile, retail trader sentiment transitioned to “Neutral.”
TradingView’s MACD indicator generated a “Buy” signal for Dogecoin. Both the Bull Bear Power metric and the Relative Strength Index remained in Neutral territory.
Dogecoin has predominantly exhibited range-bound behavior throughout April, constrained by broader cryptocurrency market headwinds. Coinglass statistics confirm that open interest in DOGE futures contracts expanded 1.61% over the past day.