
 Approaches Critical Price Barrier as Network Surpasses $1 Trillion Milestone")
Key Takeaways
- SOL encounters critical resistance between $84 and $87, while crucial support holds at $78–$82
- Technical analysis reveals a weekly broadening pattern suggesting potential move toward $1,000
- Q1 2026 marked Solana’s inaugural trillion-dollar quarter with $1.1T in network economic activity
- Active wallet addresses surged to 5.5–5.8 million, significantly exceeding the 3–4 million seen in Q4 2025
- Daily transfer volumes exploded to $75 billion even as token price remains subdued
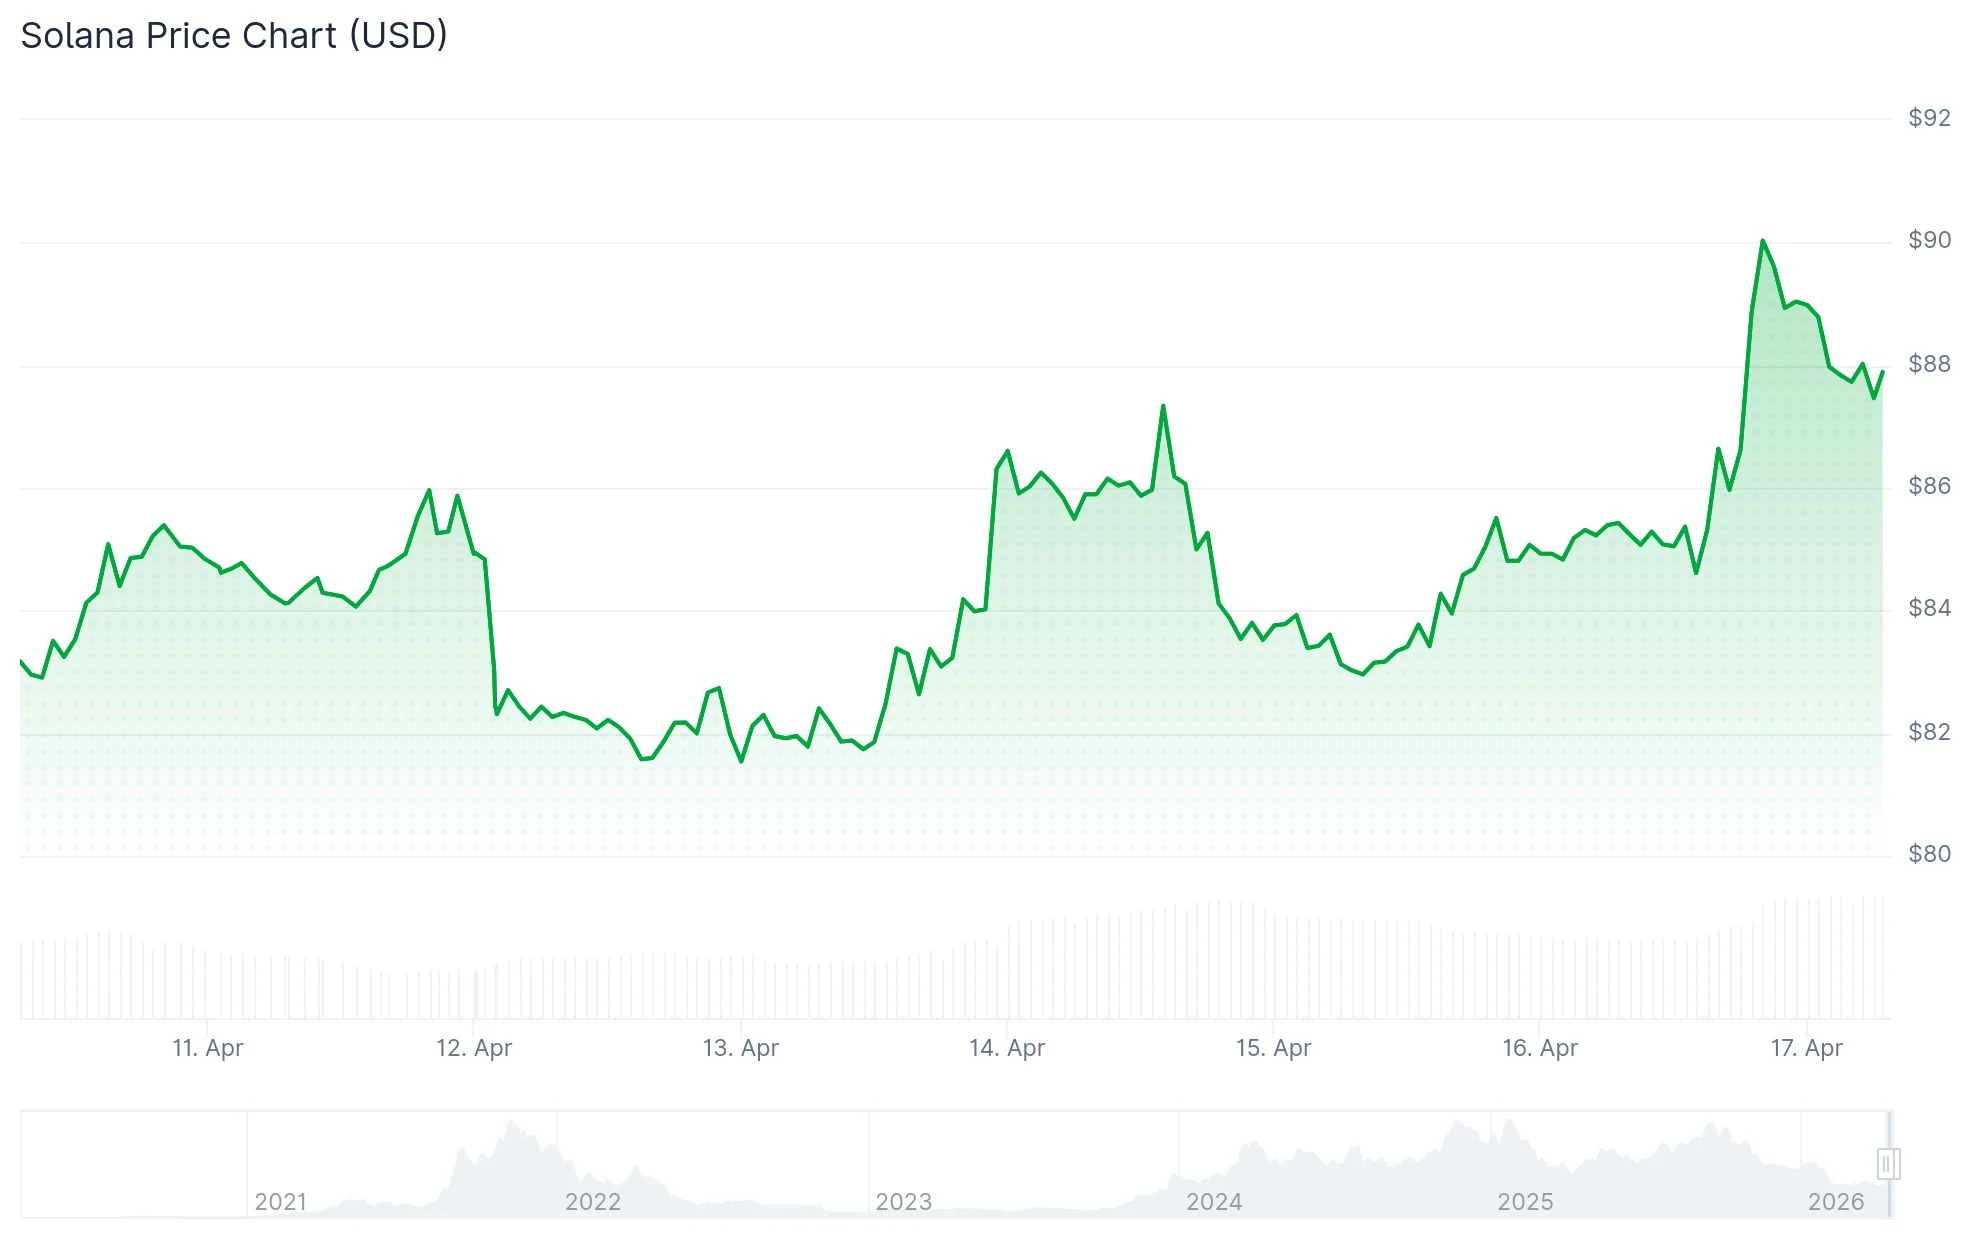
Solana finds itself at a pivotal juncture from a technical perspective. The 1-hour chart shows SOL approaching a critical resistance barrier around $84 following a rebound from the $78–$81 support region.
Multiple Fibonacci retracement levels converge within this narrow zone — specifically at $84.46, $85.06, $85.56, $86.51, and $87.03. This confluence forms a formidable supply barrier that could prove challenging to penetrate on the initial attempt.
Should SOL stumble at this resistance cluster, a retreat toward the $81.65–$78 support range appears likely. Conversely, a decisive breach above this ceiling would pave the way for a rally toward $87–$88.
Turning to the weekly timeframe, market analyst CryptoCurb has identified a developing broadening megaphone formation on X. This technical structure displays consistent interactions with both the upper resistance trendline and lower support boundary through several price cycles.
The pattern’s lower trendline continues to function as reliable support. Maintaining this foundation keeps the bullish framework viable. CryptoCurb’s upside projection, contingent on pattern confirmation, extends beyond $1,000 — although this represents a prospective scenario rather than an imminent development.
Blockchain Metrics Reach Unprecedented Levels
Beyond price movements, Solana’s fundamental network data paints an impressive picture. According to Artemis analytics, the blockchain generated $1.1 trillion in aggregate economic activity during Q1 2026. This milestone represents Solana’s debut trillion-dollar quarter.
To put this in perspective, Q3 2025 registered approximately $600 billion while Q4 2025 recorded roughly $850 billion. The sequential quarterly increase measured nearly 29%.
Active wallet addresses currently operate within the 5.5–5.8 million range, a substantial climb from the 3–4 million baseline maintained throughout most of late 2025. Address activity even momentarily peaked between 6.5–7 million during the opening weeks of Q1.
Solana dominated all major blockchain networks in Q1 2026 transaction throughput, executing 25.3 billion transactions throughout the three-month period.
On-Chain Transfer Activity Surges
Daily transfer volumes, which typically fluctuated between $5 and $15 billion during late 2025, recently exploded into the $70–$75 billion territory.
The PreStocks DEX operating on Solana additionally established a daily volume benchmark of $28.65 million.
Despite this robust network activity, SOL’s market valuation hasn’t yet captured the underlying blockchain expansion. Capital flows are accelerating substantially, but price discovery remains disconnected from these metrics — for now.
SOL’s current technical setup positions it at the $84 resistance threshold, with the $78–$81 range providing critical downside support.