
 Surges 4.5% But Analysts Warn This Could Be a Bull Trap")
TLDR
- Dogecoin hovers around $0.09, trapped within a narrow consolidation range with no decisive directional momentum.
- The Relative Strength Index reads 46.30 while the MACD indicator shows neutral conditions, signaling market equilibrium.
- DOGE rallied 4.5% to approach $0.10, delivering stronger gains than both Bitcoin and Ethereum during the trading session.
- The upward movement seems fueled by futures markets and leveraged trades instead of genuine blockchain activity.
- Technical analyst Ali Charts identified a false breakout pattern on the 12-hour timeframe, forecasting a probable drop toward $0.088.
Dogecoin currently exchanges hands near $0.09 following a 4.5% surge that momentarily brought prices within striking distance of $0.10. This upward momentum allowed DOGE to eclipse the performance of both Bitcoin and Ethereum as traders shifted capital toward more speculative cryptocurrency positions.
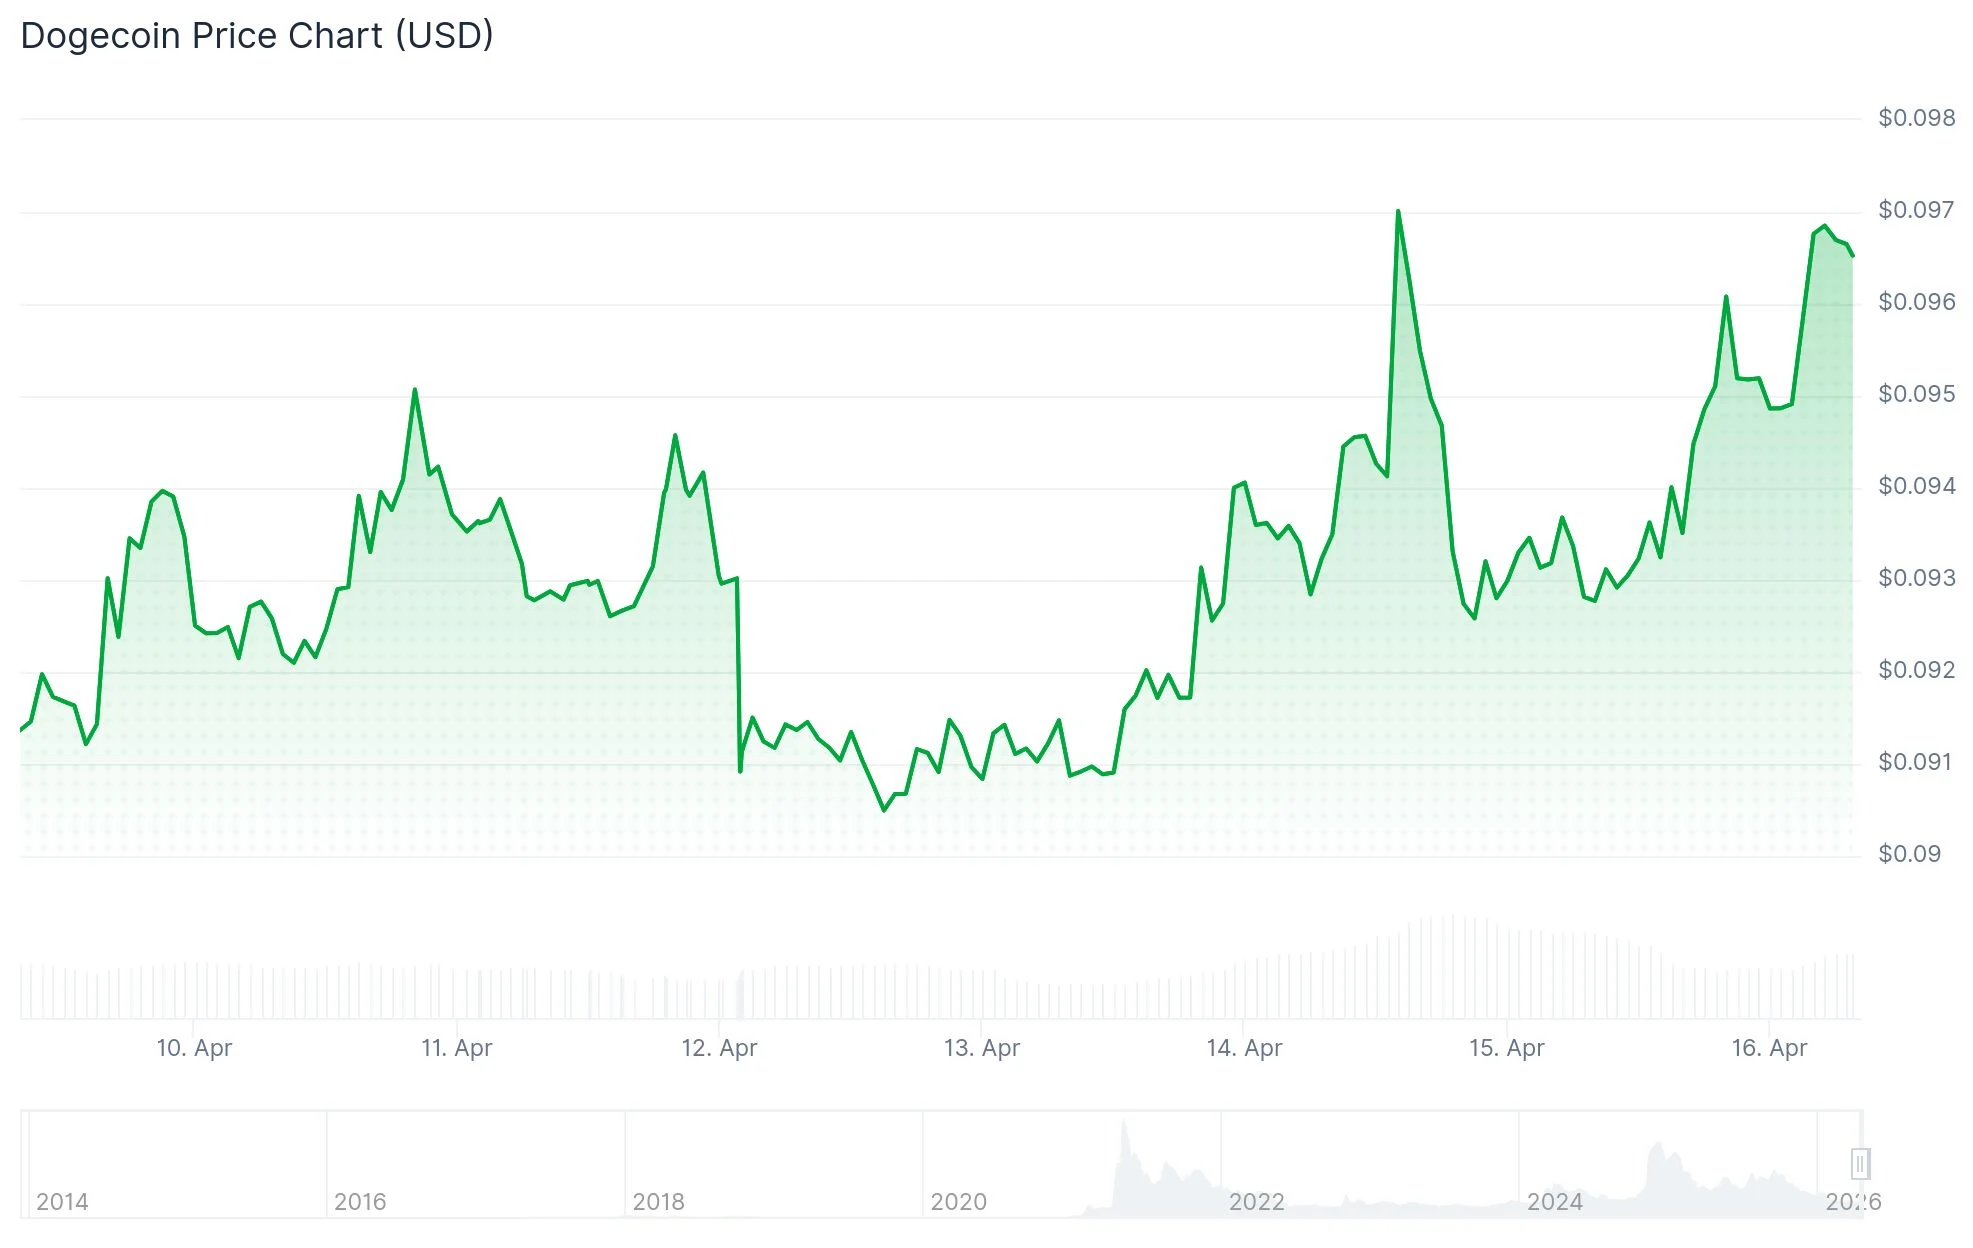
The price advancement lifted DOGE from $0.093 to $0.098, penetrating the $0.095 resistance barrier with substantial trading volume. The asset constructed a pattern of progressively higher lows before experiencing rapid acceleration during the session’s closing hour.
However, blockchain metrics tell a different story. The count of daily active addresses continues declining, indicating the price movement stems primarily from derivatives trading and leveraged speculation rather than authentic network utilization.
Intense buying pressure during the late trading period suggested institutional participation, especially during the thrust through $0.097. Trading volume data verified genuine market engagement rather than superficial movement through shallow liquidity pools.
Technical Analyst Issues Fakeout Alert
Cryptocurrency market analyst Ali Charts identified an apparent false breakout on the 12-hour chart structure. DOGE attempted to escape from a descending triangle formation, but the downward-sloping resistance trendline maintained its influence and swiftly pushed prices back down.
Ali Charts explained that when breakout attempts fail with such pronounced rejection, market participants typically search for liquidity zones at the pattern’s base. The analyst identified $0.088 as the probable downside target, describing it as the “critical threshold” for this price structure.
The RSI indicator registers 46.30, demonstrating equilibrium between buying and selling forces. The MACD histogram displays minimal movement, indicating bearish momentum has decelerated without transitioning to bullish territory.
Critical Price Thresholds Under Observation
Bollinger Bands illustrate DOGE positioning closer to the lower boundary near $0.09, while the upper band around $0.10 maintains its role as a ceiling.
Several short-term and intermediate-term moving averages converge around $0.09, strengthening its function as a support foundation. DOGE remains substantially beneath its long-term average positioned near $0.14, indicating a persistent bearish framework.
Market participants are monitoring $0.096 as immediate support. Maintaining price action above this threshold preserves the current breakout scenario.
$0.104 represents the crucial resistance barrier. A decisive breach above this level would transform the technical structure toward a more bullish configuration. Conversely, a retreat below the $0.092–$0.090 zone would likely trigger a more substantial correction.
The overall technical pattern remains characterized by compression beneath descending resistance rather than representing a confirmed trend reversal.