
 Plunges 43% — AI Forecasts Where the Cryptocurrency Will Find Support")
Contents
Key Takeaways
- Historical bear markets pushed Bitcoin down 77–85% from peak levels; applying similar declines to the 2025 high of $126,198 suggests potential lows between $19,000 and $29,000.
- Current market structure suggests this pullback resembles a correction within an ongoing bull trend rather than the onset of a prolonged bear market.
- Primary support is anticipated in the $58,000–$68,000 zone, though a steeper drop could push prices toward $48,000–$58,000.
- Historical cycle bottoms typically emerged 12–13 months post-peak, suggesting October–November 2026, though present technical patterns don’t strongly validate this timeframe.
- Confirmation of a market floor requires monitoring strong weekly closes, recaptured resistance levels, and bullish weekly RSI divergence.
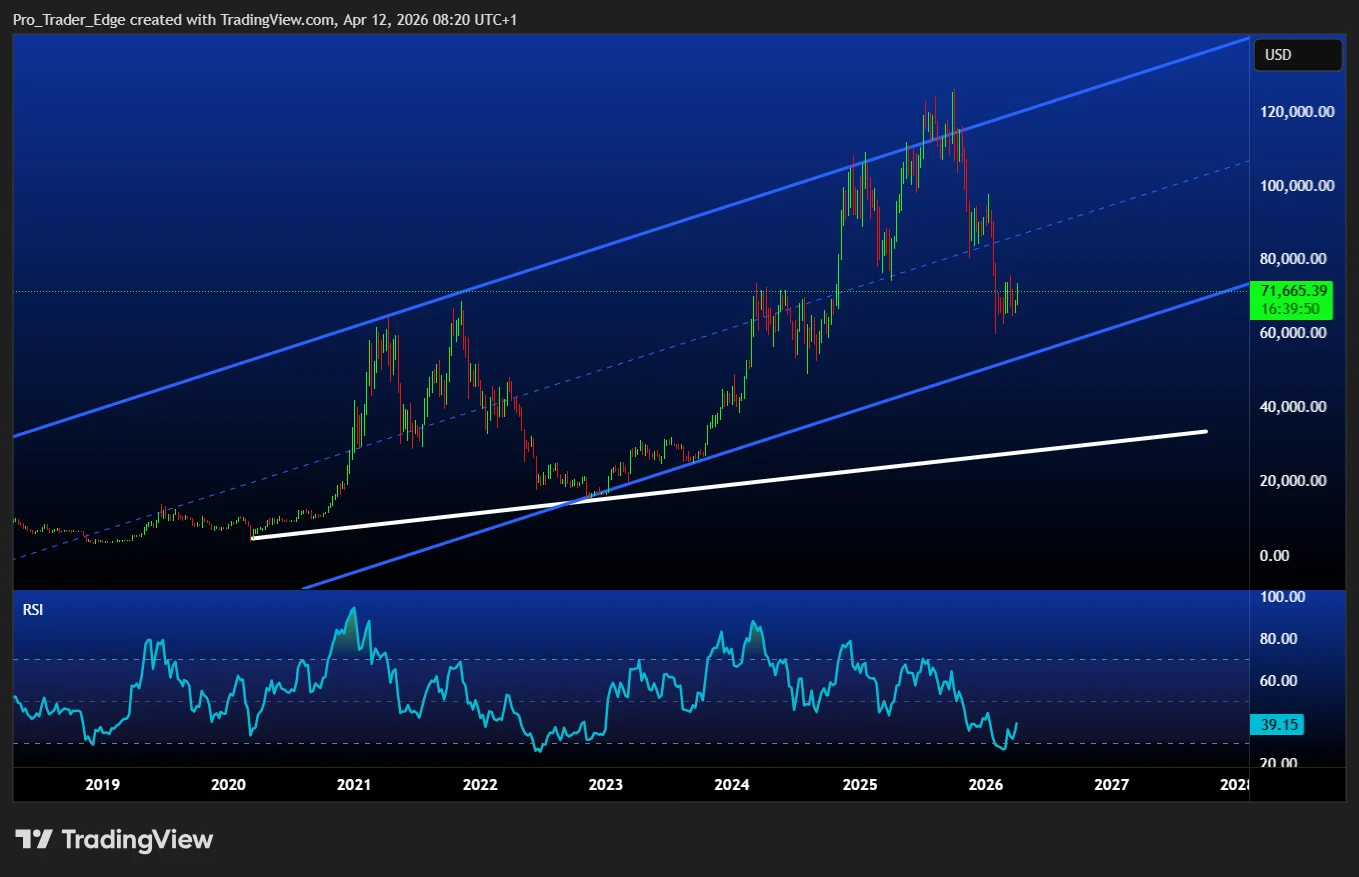
Bitcoin reached its record high of $126,198 on October 6, 2025, based on CoinGlass data. The cryptocurrency has since retreated to approximately $71,000, prompting the recurring question that surfaces during every market cycle: are we witnessing a temporary pullback or the beginning of a major downturn?
Historical precedent offers valuable perspective. Bitcoin experienced an 85% decline following its 2013 peak, an 84% drop after the 2017 top, and a 77% decrease from its 2021 maximum. Applying similar percentage corrections from $126,198 could theoretically push prices down to $19,000–$29,000 under the most bearish circumstances.
Yet weekly chart analysis indicates this cycle might deviate from that historical blueprint. The long-term ascending channel structure remains unbroken. The present price action appears more consistent with a retracement following a rejection near channel resistance rather than a breakdown signaling a multi-year bear phase.
Nevertheless, market analysts maintain that the ultimate low hasn’t been established. The weekly Relative Strength Index demonstrates continued weakness, and momentum indicators haven’t reversed course. While the market appears stressed, it hasn’t reached the capitulation phase characteristic of major bottoms.
Projected Support Zones
Based on technical chart patterns, the highest probability support area lies between $58,000 and $68,000. This range corresponds to approximately a 46%–54% retracement from October 2025’s peak.
A more severe correction pushing into the $48,000–$58,000 territory—representing a 54%–62% drawdown—remains within the realm of possibility should panic selling intensify. Both ranges would constitute significant corrections while remaining considerably above the 80%-plus collapses witnessed in previous cycles.
An alternative bullish scenario exists as well. Should substantial buying pressure materialize swiftly, a shallower bottom forming between $68,000 and $74,000 cannot be entirely dismissed.
Historical cycle analysis reveals Bitcoin bottoms typically materialized approximately 12–13 months following the preceding peak. Extrapolating from the October 2025 high suggests a potential floor around October–November 2026, assuming that marked the genuine cycle apex.
Current Technical Picture
However, present chart characteristics don’t definitively exhibit the signature blow-off-top-and-collapse formation typical of cycle endings. The structure more closely resembles a substantial correction within a higher-timeframe uptrend that continues to advance.
If this interpretation proves accurate, the market floor could materialize within weeks to several months rather than extending into late 2026.
Technical confirmation signals for an established bottom include robust weekly candle closes, reclamation of proximate resistance thresholds, and weekly RSI establishing a bullish reversal. To date, none of these confirmations have materialized.
Bitcoin trading at $71,000 represents better value compared to peak levels, yet analysts haven’t identified a definitive, high-probability bottom formation.
Conclusion
Investors seeking to identify the market bottom should conceptualize support in terms of zones rather than precise price points. The optimistic scenario envisions a shallow correction finding support near $68,000–$74,000. The baseline expectation centers on $58,000–$68,000. Should prices breach $48,000, the technical landscape would increasingly resemble a genuine bear market rather than a corrective phase within a bull cycle.