
 Faces Pressure as ETF Outflows Surge and Analysts Target $45–$75 Entry Zone")
TLDR
- Solana climbed more than 2% on Monday following a consecutive four-day decline that resulted in a 5% weekly loss.
- US-listed Solana spot ETFs saw $7.84 million in withdrawals on Friday, marking the fourth-highest single-day outflow since inception.
- More than $22.98 million worth of SOL derivative contracts were liquidated within 24 hours, with long positions representing $19.18 million.
- The funding rate has shifted into negative territory at -0.0141%, indicating traders are compensating others to maintain short positions.
- Critical support lies within the $70–$75 range, with market observers anticipating a possible decline to $50 if this level fails to hold.
Solana is attempting a modest comeback following a challenging week, yet underlying market data paints a concerning picture. Exchange-traded fund withdrawals, substantial liquidations, and pessimistic derivatives metrics indicate this recovery could be fleeting.
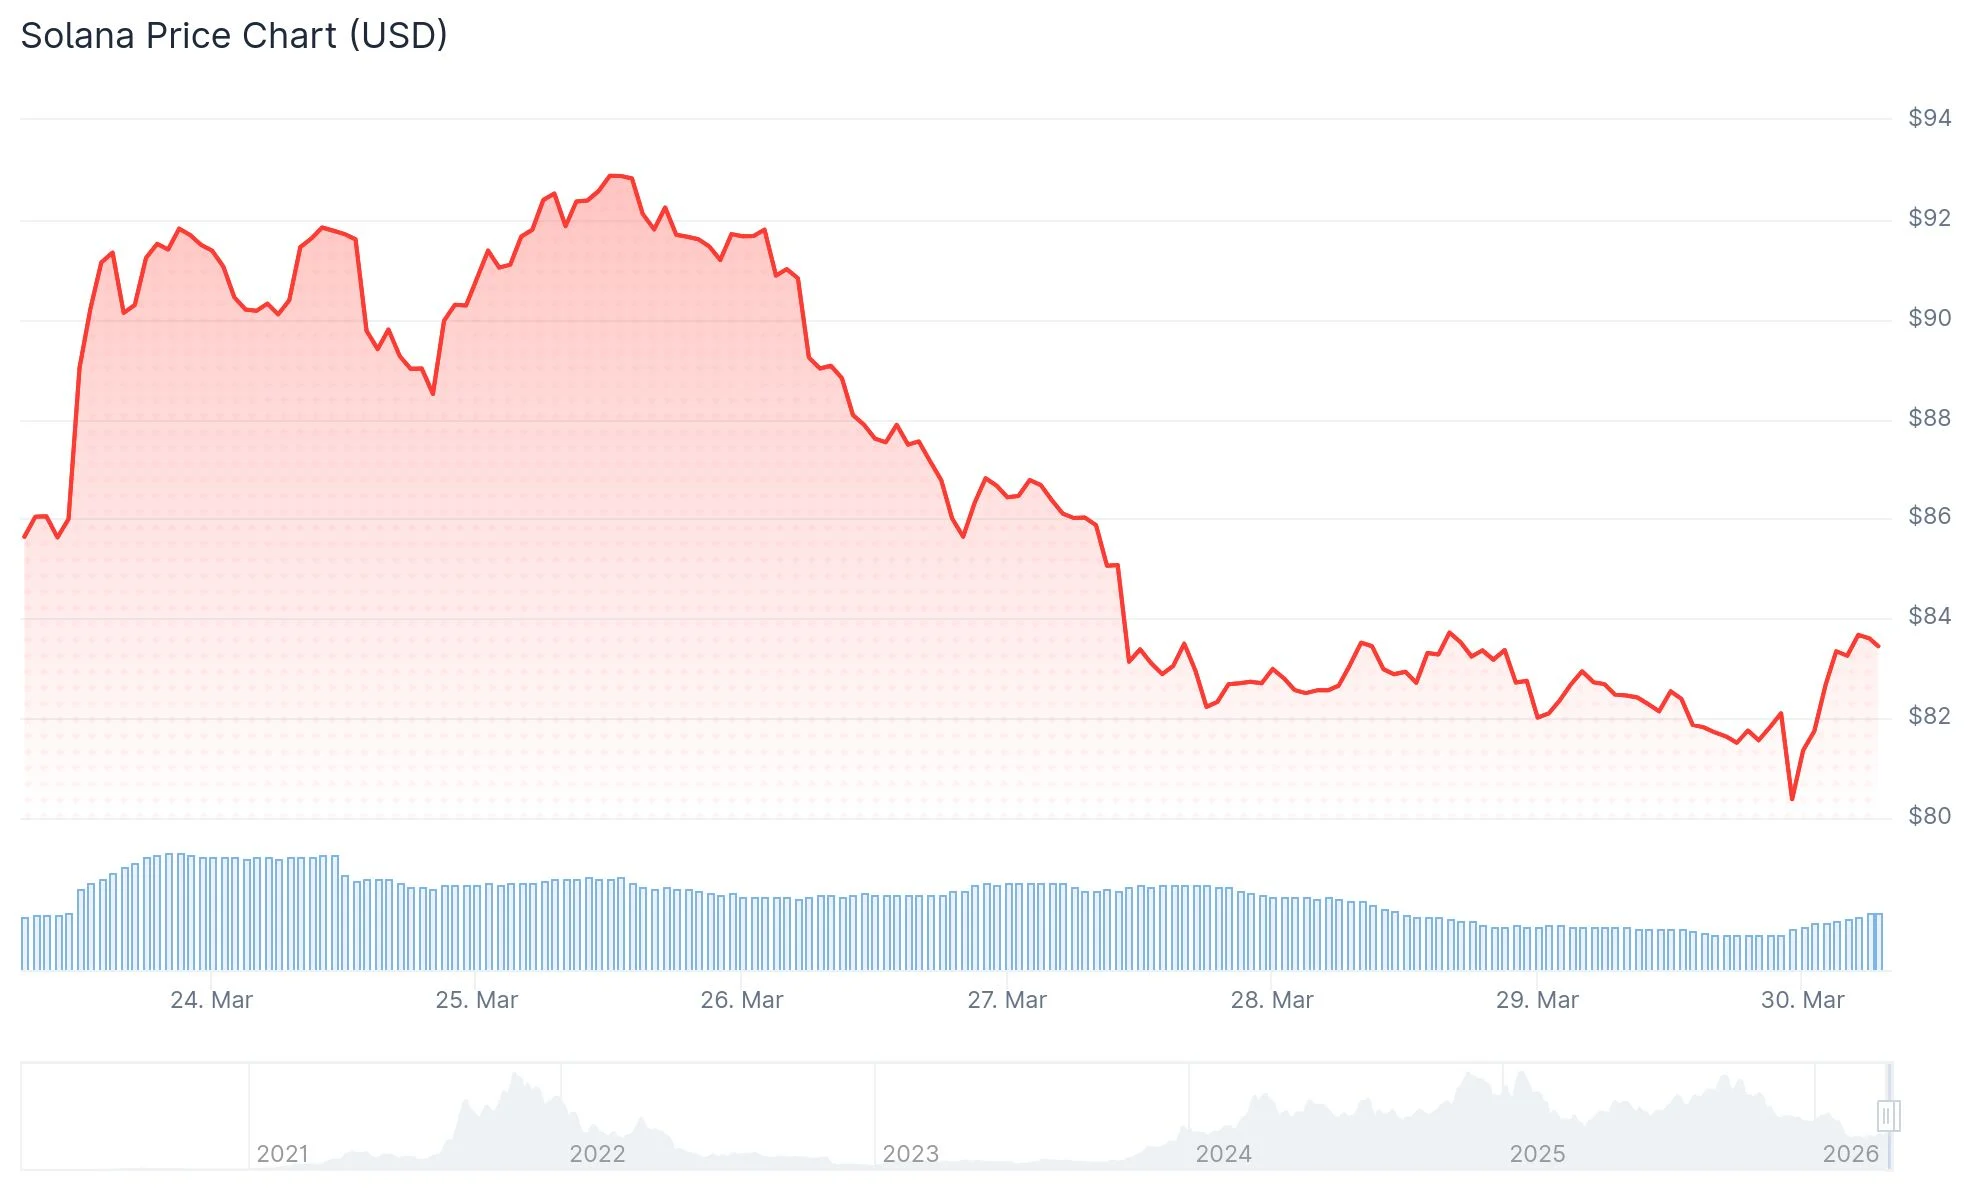
Solana concluded last week with approximately a 5% decline, briefly dipping to lows slightly above $81 before registering a 2%+ gain on Monday. The cryptocurrency breached a rising support trendline around $88, a development that technical analysts flagged as a significant inflection point.
The 50-day, 100-day, and 200-day Exponential Moving Averages (EMAs) are all positioned above current trading levels, reinforcing the bearish technical setup. SOL would require a sustained daily close above $91 to begin reversing this negative momentum.
The MACD indicator has recently crossed beneath its signal line and descended into negative territory. Meanwhile, the RSI stands at 42, below the neutral 50 threshold, signaling that selling pressure continues to dominate.
US spot Solana ETF products experienced $7.84 million in net withdrawals on Friday alone. This represented the fourth-largest single-day exodus since these investment vehicles launched, and it extended a streak of negative weekly flows to three consecutive weeks.

Should institutional money continue flowing out during the current week, additional downward pressure would likely accumulate on an already vulnerable price structure.
In the derivatives market, $22.98 million in SOL contracts were forcibly closed over the past 24 hours. The overwhelming majority—$19.18 million—consisted of long positions getting stopped out.
The negative funding rate of -0.0141% reveals that traders are paying a premium to maintain short exposure, providing a direct window into prevailing bearish market sentiment.
Analysts Eye $70–$75 as the Key Zone
Crypto analyst Patel shared a two-week chart demonstrating SOL has declined approximately 77% from its all-time peak near $250. His technical analysis identifies a critical support and potential entry zone ranging between $45 and $75, with a Fibonacci retracement level at $52.11 representing a deeper downside target.
Patel observed that bullish voices were abundant when Solana traded above $250, but have grown conspicuously silent with prices below $80. He interprets the current weakness as a possible accumulation opportunity for patient investors, projecting long-term price targets of $500 and $1,000.
A complementary assessment from More Crypto Online utilized a one-hour timeframe to illustrate how Solana had violated a short-term ascending trendline. This analyst characterized the breakdown as a potential “wave 3” decline, targeting a support zone spanning $71.91 to $77.91.
What the Charts Say Now
Immediate support rests at the recent bottom of $81.44. A breakdown below this level would expose $75.63, the February 24 low that initiated the previous upward trend.
Resistance overhead is concentrated between $84.85 and $87.71, with the 50-day EMA at $91.24 representing a more substantial obstacle.
SOL ETF activity is under intense scrutiny, with Friday’s $7.84 million withdrawal providing the most tangible evidence of institutional caution to date.