
 Rallies 7% as Market Eyes Critical $100 Breakthrough")
TLDR
- Solana climbed more than 7% within 24 hours, peaking at $97.67 while the overall crypto market gained approximately 3.6%.
- The network’s total value locked (TVL) increased by 25% over the last 30 days, reflecting renewed investor confidence.
- Price action shows SOL holding above $92 and its 100-hour simple moving average, with bullish support forming around $94.
- Critical resistance zones are positioned at $98 and $100, while support stands at $92 and $88 should a correction emerge.
- The token has appreciated over 40% since hitting its February bottom, with the RSI indicator climbing toward 60 from previously oversold territory.
Solana has delivered impressive performance over the past day, rallying more than 7% to reach a peak of $97.67 before settling into consolidation around the $95 level. This upward movement aligns with a broader cryptocurrency market recovery that saw gains of approximately 3.6% during the same timeframe.
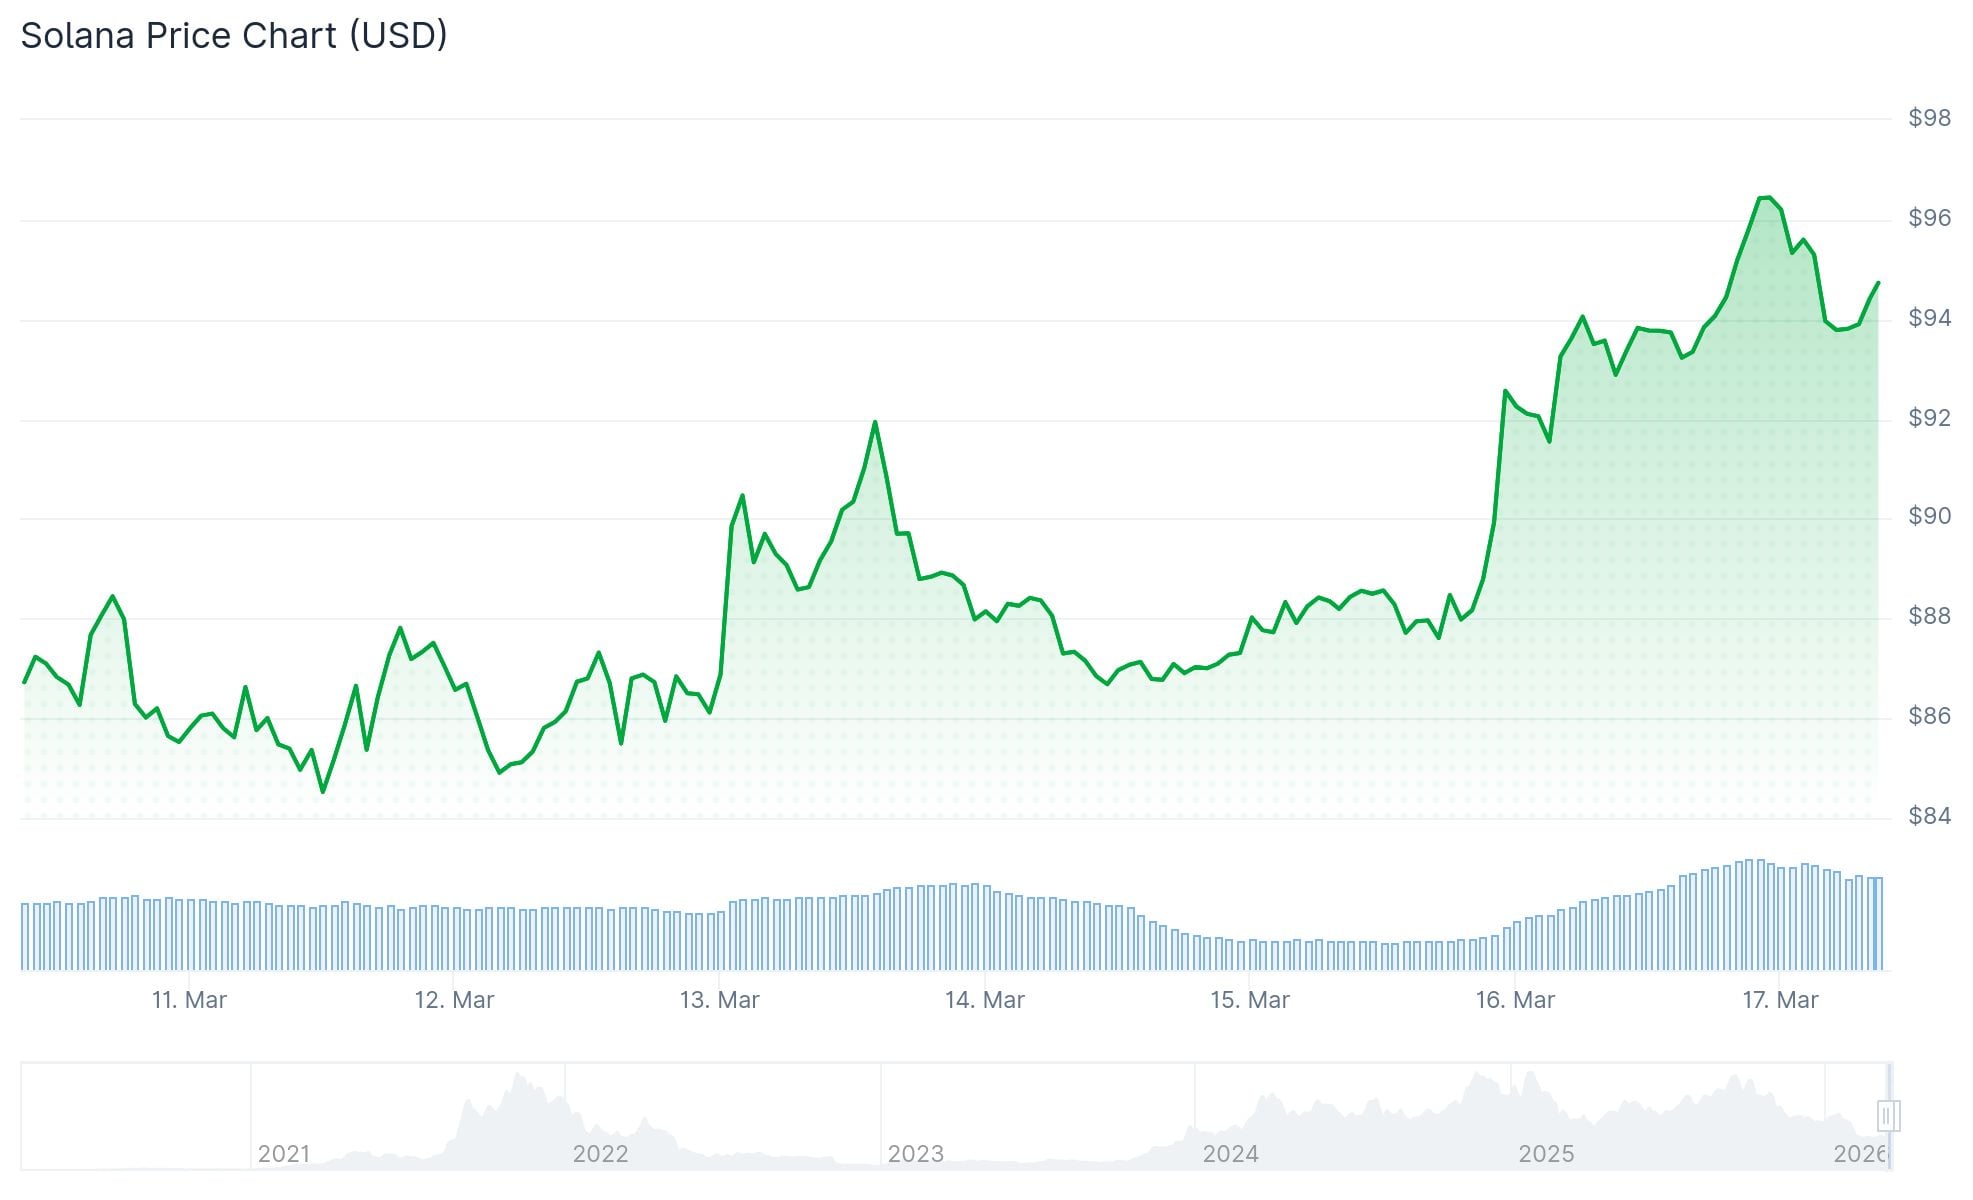
Currently, SOL maintains its position above the $92 threshold and continues trading above its 100-hour simple moving average. Technical analysis reveals a bullish trend line has developed with support established at $94 on the hourly timeframe, according to data sourced from Kraken.
Critical Resistance Zones Emerge
The cryptocurrency now confronts immediate resistance around $95, with subsequent barriers positioned at $98. The psychologically significant $100 level represents the primary challenge ahead. Successfully breaking and closing above $100 would likely pave the way toward $105, with extended targets reaching $112.
Should downward pressure materialize and SOL loses the $92 support zone, the next defensive level sits at $88. Breaking beneath $88 could potentially bring $82 into focus.
While the recent advance corresponds with the broader market’s rebound, Solana has notably outpaced the majority of other top-10 cryptocurrencies throughout this period.
On-Chain Metrics Reinforce Bullish Sentiment
The total value locked across Solana’s ecosystem has expanded by 25% throughout the previous month. This metric tracks the amount of capital deployed within a blockchain’s infrastructure, and such substantial growth indicates heightened platform engagement.
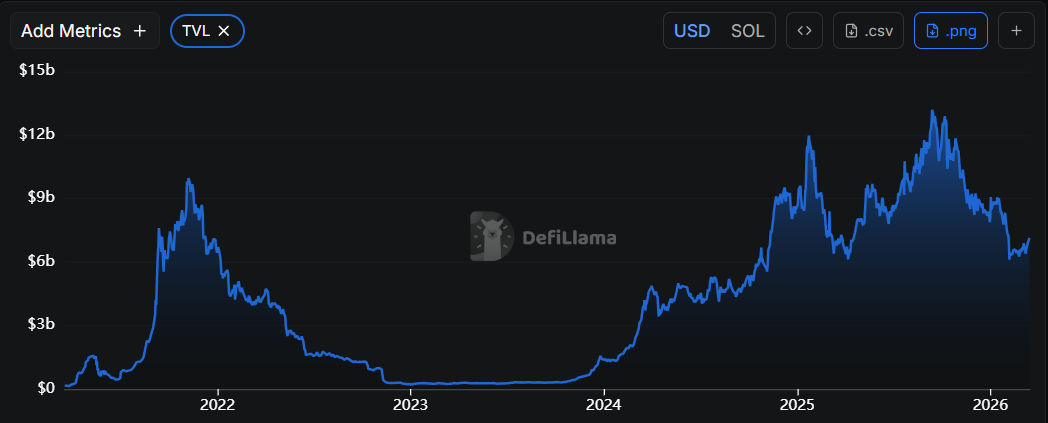
Development work and new decentralized application deployments on the platform have maintained consistent momentum. These fundamental blockchain indicators have contributed significantly to the current bullish price action.
Solana has registered gains exceeding 40% from the lows established in February. The Relative Strength Index has recovered toward the 60 level after rebounding from oversold conditions seen earlier this year.
Recent weeks have seen price action oscillating between support at $80 and resistance near $95, creating a consolidation structure that technical traders frequently monitor for potential breakout opportunities.
The 200-day moving average continues to trade above present price levels, suggesting the long-term trend has yet to complete its reversal.
SOL is currently valued at roughly $94.62, commanding a market capitalization near $54 billion, with its 52-week trading range spanning from $70.61 to $252.78.