
 Consolidation Could Signal Major Breakout as Analysts Eye $3 Target")
Key Takeaways
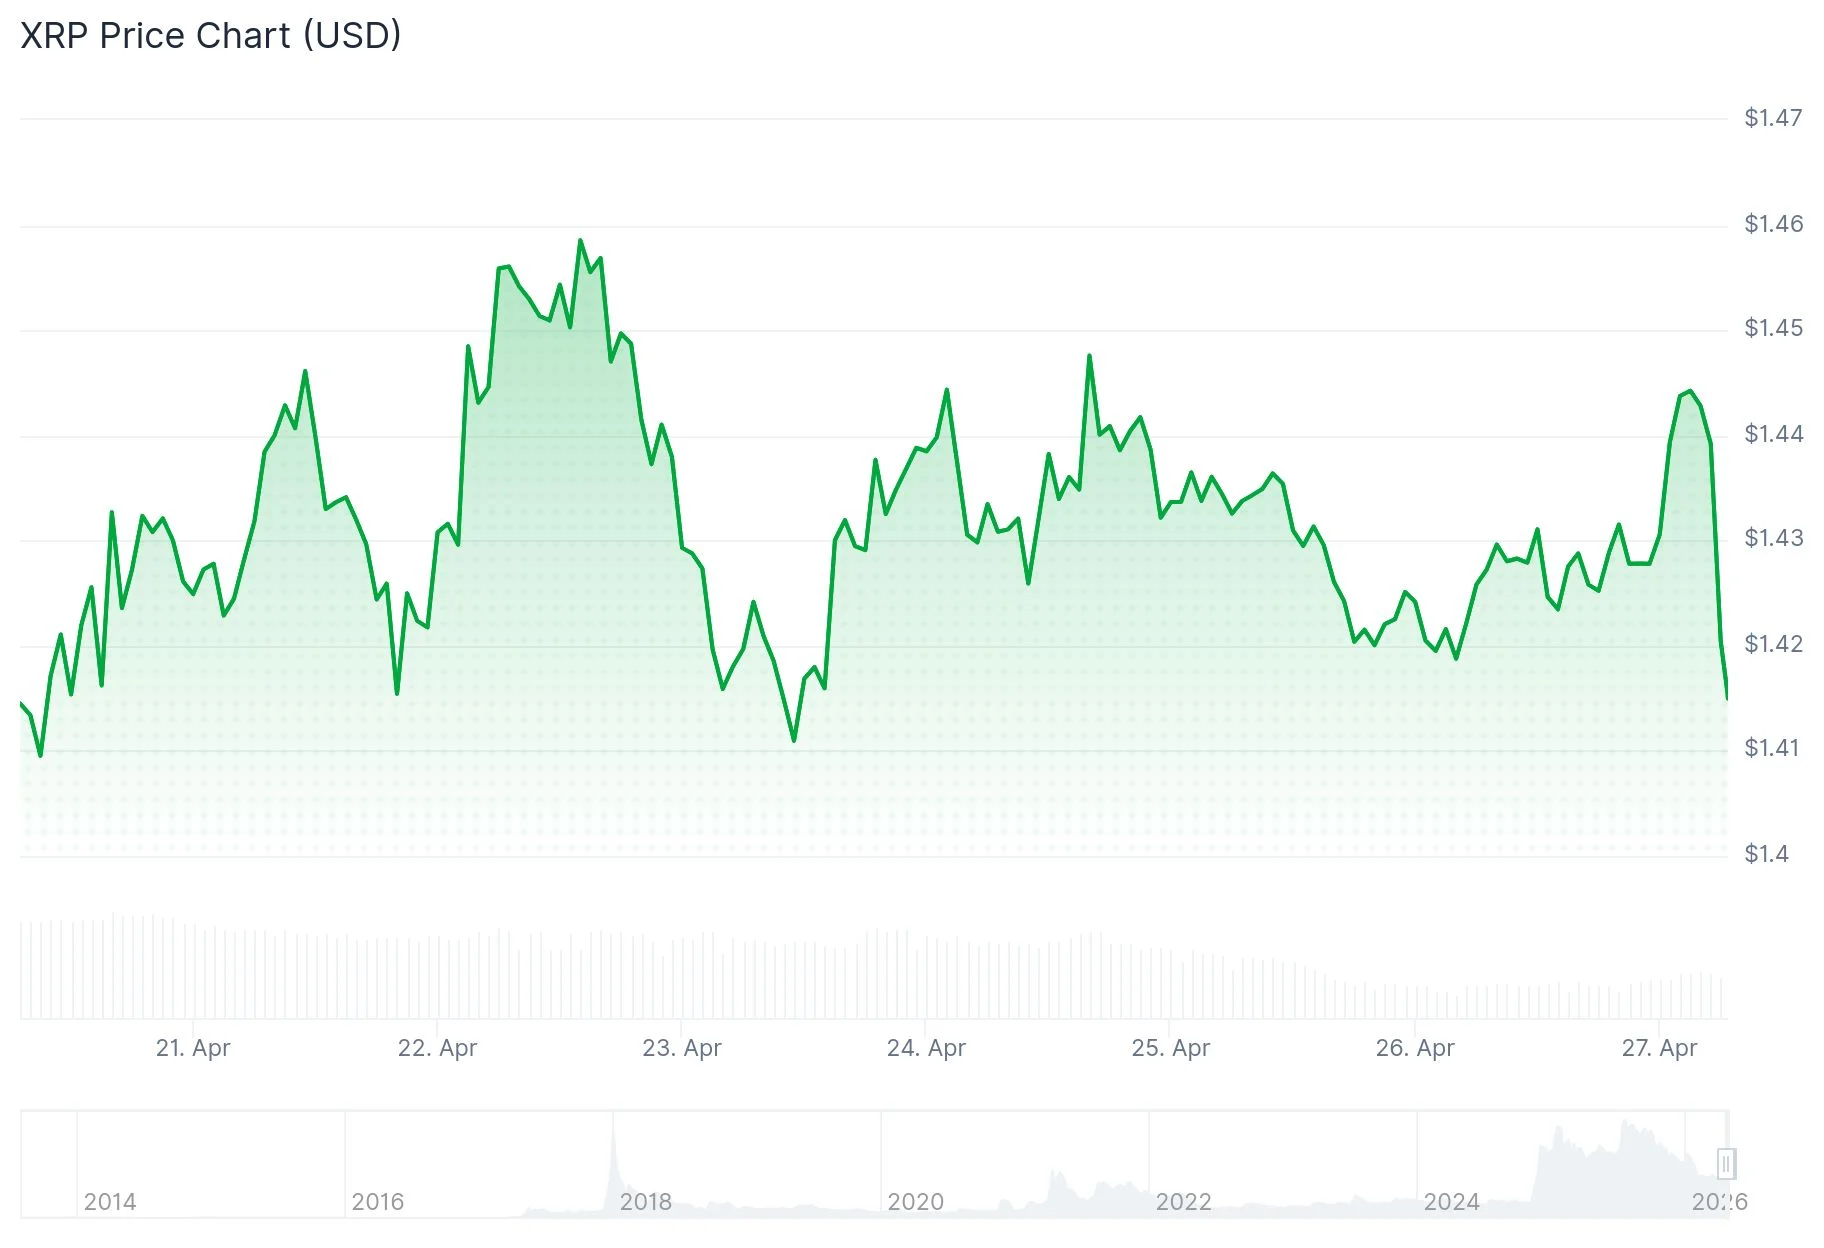
- XRP maintains a $1.42 price level with an $87.93 billion market capitalization and 24-hour trading volume of $1.09 billion
- Technical indicators reveal price compression forming near critical 20-day and 50-day exponential moving averages
- The Relative Strength Index hovers between 54 and 55, indicating balanced momentum with slight bullish bias
- Bulls targeting a decisive move above $1.45–$1.50 resistance that could trigger a rally toward $3.00
- Bears watching $1.10 support level, with a breakdown potentially driving price down to $0.90
XRP continues to trade around the $1.42 mark, displaying minimal volatility throughout the past seven days. The digital asset has maintained a remarkably tight trading range, suggesting a period of market indecision.
Daily trading volume registered at $1.09 billion, representing approximately a 4% decline from previous sessions. The overall market capitalization remains anchored near $87.93 billion, demonstrating relative stability in investor holdings.
This sideways price action indicates neither aggressive accumulation nor significant distribution, with the market appearing to digest recent movements before committing to a clear directional bias.
Crypto analyst EGRAG CRYPTO recently highlighted an interesting shift in trader behavior, observing that market participants are increasingly analyzing line charts instead of traditional candlestick formations. This approach helps eliminate short-term volatility noise and provides clearer insight into broader trend developments.
EGRAG CRYPTO’s analysis identifies a textbook compression structure emerging in XRP’s price action — characterized by descending peaks converging with a well-established support foundation. These technical formations often precede significant breakout movements as market energy builds within a tightening range.
The monthly timeframe shows the 50-period exponential moving average providing solid underlying support. EGRAG CRYPTO also suggested the possibility of a brief dip toward the 100 EMA before any substantial expansion phase materializes, which would represent a healthy retest before upward continuation.
Intraday Technical Analysis
Examining the hourly timeframe reveals XRP reached an intraday peak of $1.4471 before experiencing a modest retracement. Price action continues to respect the 100-hour Simple Moving Average while maintaining position above an ascending trend line with critical support established near $1.4320.
Multiple shorter-duration exponential moving averages — specifically the 10, 20, 30, and 50-period EMAs — are all positioned beneath current price levels and generating bullish signals. This configuration indicates that dips are attracting buyer interest, with participants entering positions at lower price points.
The primary resistance barrier stands at $1.45, where a convincing breakthrough could unlock pathways toward $1.4650, subsequently $1.4840, and ultimately the psychologically significant $1.50 level. Beyond that threshold, traders are monitoring $1.5150 as the next substantial obstacle.
Regarding downside protection, initial support materializes at $1.44, with secondary backing at $1.4320. Should price action close decisively below $1.4320, attention would shift to $1.4050 and the round number support at $1.40.
Momentum Indicators and Critical Price Zones
The Relative Strength Index currently registers between 54 and 55, positioned comfortably above the neutral 50 mark following a recovery from oversold conditions observed during February. The Moving Average Convergence Divergence has generated a modest bullish crossover, though technical analysts caution this signal lacks the conviction necessary to validate an imminent breakout.
Additional momentum oscillators including the stochastic RSI and commodity channel index remain centered around equilibrium zones. This convergence of neutral readings across multiple indicators portrays a market in waiting mode, anticipating a catalyst to establish the next directional trend.
Pivot point analysis places the central reference level near $1.41. Overhead resistance emerges at $1.51, with extended targets at $1.72 and $2.04 should bullish momentum accelerate. Conversely, support structures below current levels appear at $1.22, followed by more substantial floors at $1.10 and $0.90.
XRP is presently maintaining position just above the $1.41–$1.43 pivot range, which technical strategists identify as the critical zone that will likely determine the asset’s next significant price trajectory.