

Key Takeaways
- XRP maintains position near $1.40, a critical support zone, as bearish signals develop on shorter timeframes
- Technical charts reveal a descending triangle formation with MACD indicator showing negative crossover
- The Relative Strength Index declined to 40, indicating diminishing bullish momentum
- Exchange-traded products tracking XRP attracted between $15.74M and $25M in capital last week
- Technical analyst Ali Charts suggests XRP is positioned for significant movement, identifying potential cycle low at $1.30
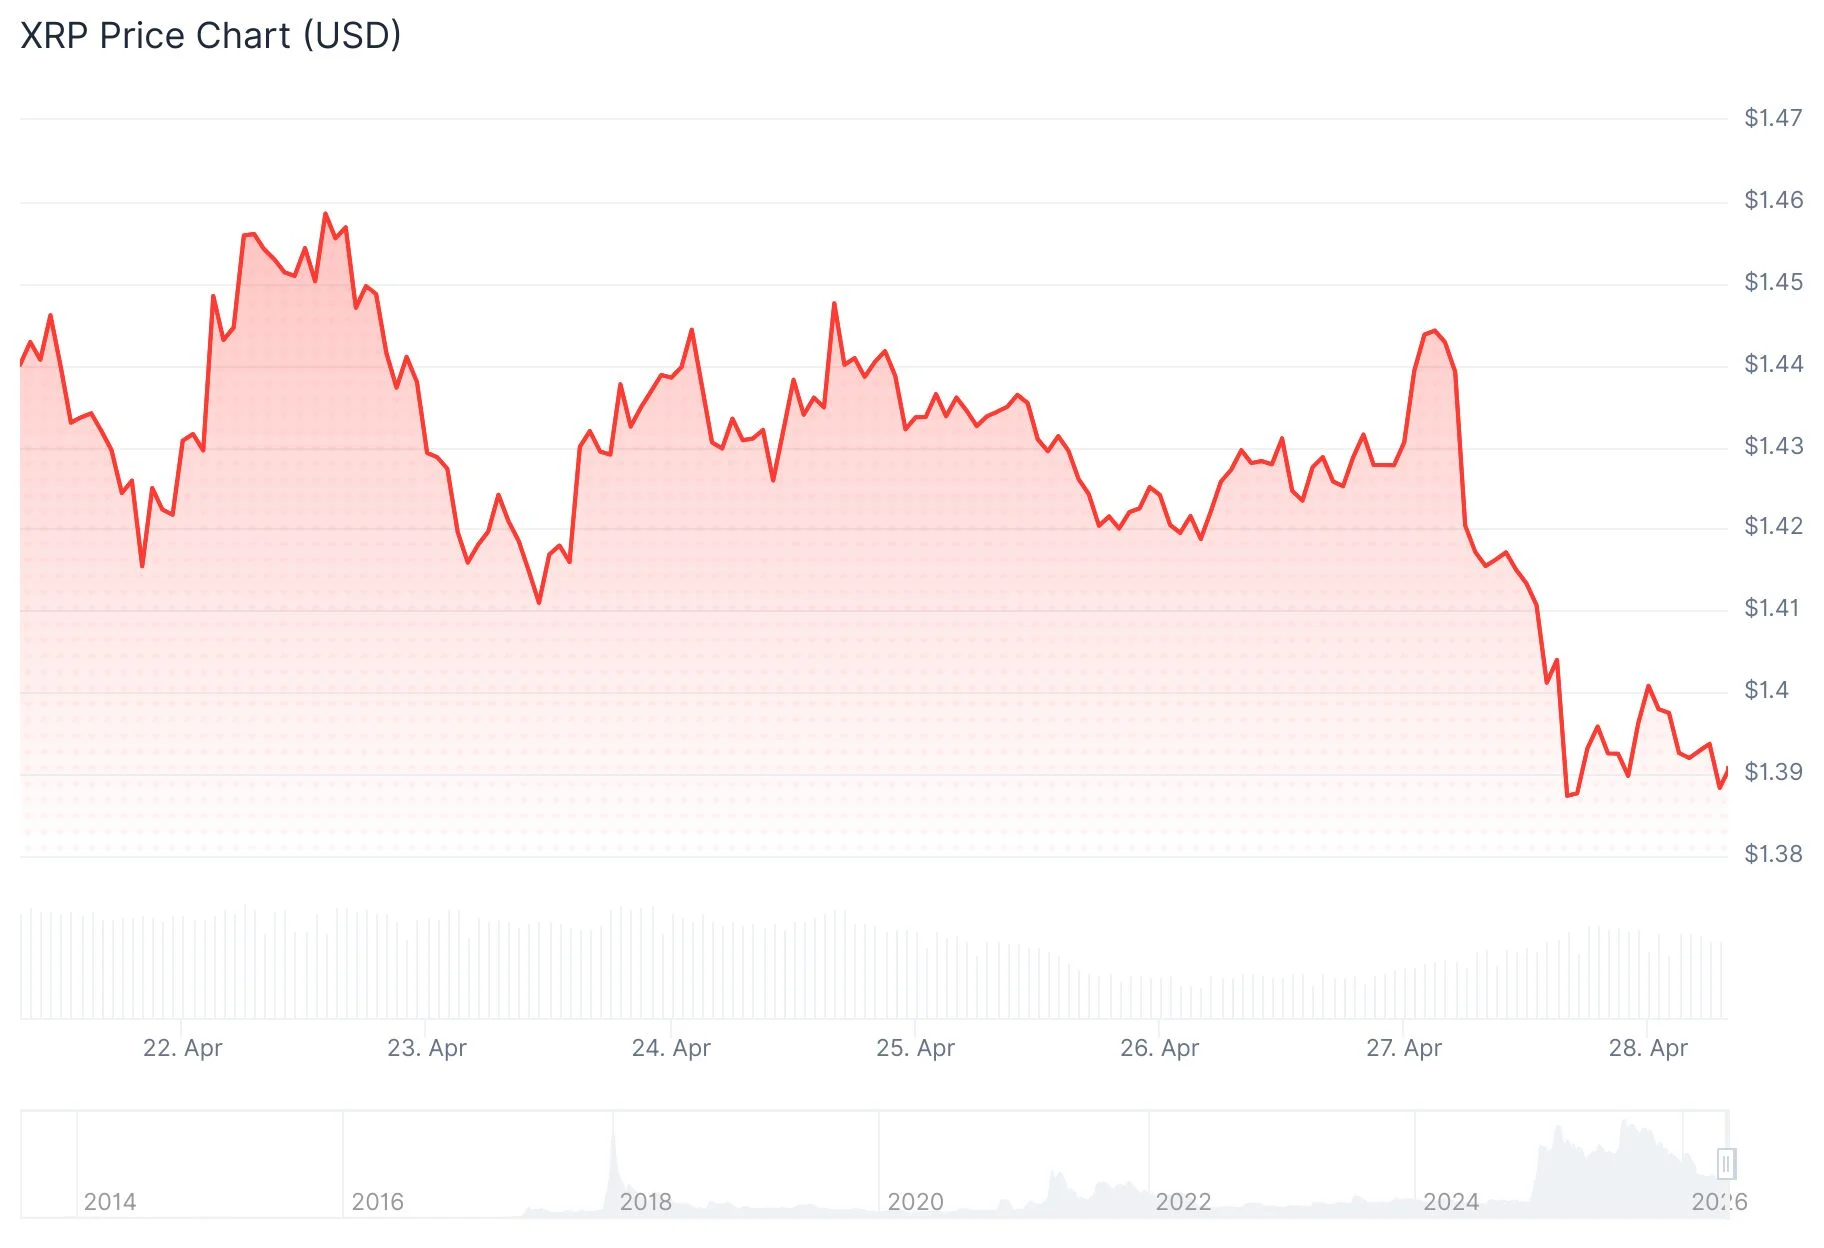
XRP currently trades in the vicinity of $1.40 following an inability to sustain earlier weekly advances. The digital asset faces mounting selling pressure as bearish forces reassert dominance and technical momentum shifts negative.
Technical analysis of the 4-hour timeframe reveals an emerging descending triangle configuration. This chart structure consists of progressively lower peaks approaching a horizontal support boundary. Such patterns typically suggest additional downside risk should the support level fail.
The Moving Average Convergence Divergence (MACD) indicator has completed a bearish crossover beneath its signal line. Expanding red bars on the histogram confirm accelerating downward momentum. Meanwhile, the RSI indicator has declined to approximately 40, reflecting waning demand from buyers.
The $1.40 price level has faced multiple challenges during recent trading periods. Support zones that endure repeated testing typically experience diminishing resilience, elevating the probability of eventual failure.
Should XRP breach the $1.40 threshold, subsequent support areas emerge at $1.38, followed by $1.36, with $1.34 representing a deeper potential target under sustained selling.
Critical Resistance Zones Above Current Price
For bullish reversal, market participants must first recapture $1.43. A more substantial obstacle exists at $1.45, which coincides with the descending trendline resistance. Successful penetration above $1.45 would establish a pathway toward $1.50.
Over the trailing 30-day period, Bitcoin and Ethereum have posted returns of 17% and 16% respectively. In contrast, XRP has delivered merely 5% gains during the identical timeframe, demonstrating that capital continues flowing toward established large-cap digital assets.
Market analyst Ali Charts shared on X that “$XRP is ready for a big price move,” although the commentary did not specify directional expectations or price objectives.
One technical researcher highlighted that XRP’s weekly RSI touched 30 in early March. Historical analysis shows that during the three prior instances when RSI fell beneath 33, XRP subsequently rallied between 226% and 1,460% over following months.
Drawing from this historical precedent, FX Empire analysts propose that the cyclical bottom may have already materialized at $1.30. Their outlook identifies $1.50 as a near-term objective, with $1.65 representing the next resistance tier.
Institutional Capital Flows Into XRP Products
Investment vehicles tied to XRP performance captured between $15.74 million and $25 million in net inflows throughout the previous week, with variation attributed to different tracking methodologies. Cumulative year-to-date inflows for XRP ETFs have reached $148 million.
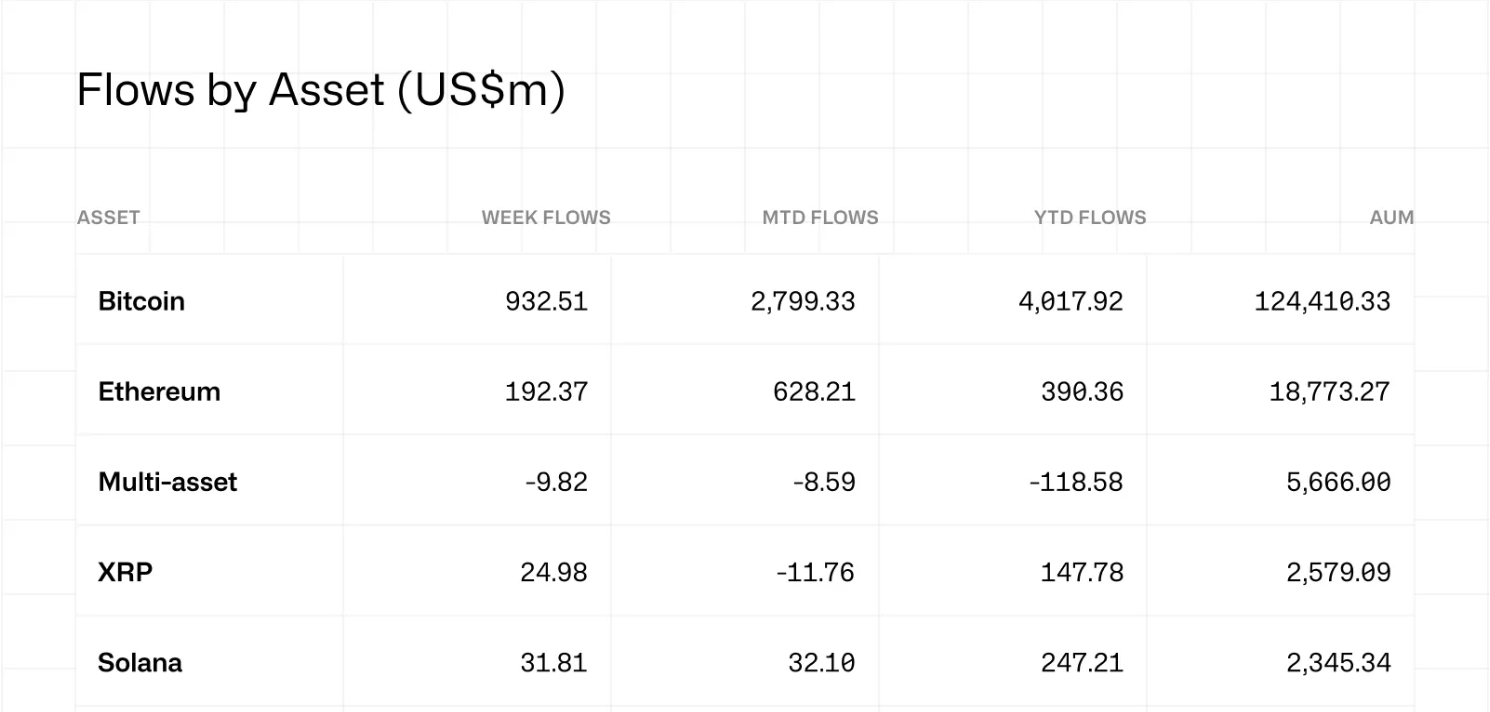
Bitcoin-focused ETFs dominated cryptocurrency fund flows with $824 million in weekly contributions, extending their positive streak to four consecutive weeks. Ethereum investment products captured $155 million, while Solana-linked funds secured $9.44 million.
The comprehensive cryptocurrency exchange-traded product sector recorded $1.2 billion in aggregate inflows last week, per CoinShares data. The Crypto Fear and Greed Index presently registers 44, retreating from its recent peak of 62.
The Federal Open Market Committee convenes on April 28, with market participants monitoring closely. Consensus expectations anticipate no adjustment to interest rates, and analytical projections suggest no rate reductions throughout the remainder of the calendar year.