

Key Takeaways
- XRP (XRP) currently hovering between $1.43 and $1.45, showing a 1.2% uptick over the past day
- Critical resistance zone established at $1.44–$1.50, while support maintains stability around $1.35
- Bullish Gartley harmonic formation approaching completion with upside projection reaching $2.64
- Symmetrical triangle compression on daily timeframe suggests imminent directional volatility
- Technical analyst EGRAG CRYPTO identifies $2.30 as initial upside objective following resistance breach
XRP is consolidating within a compressed range while multiple technical formations develop simultaneously. Market watchers are monitoring these structures for confirmation of the next significant price movement.
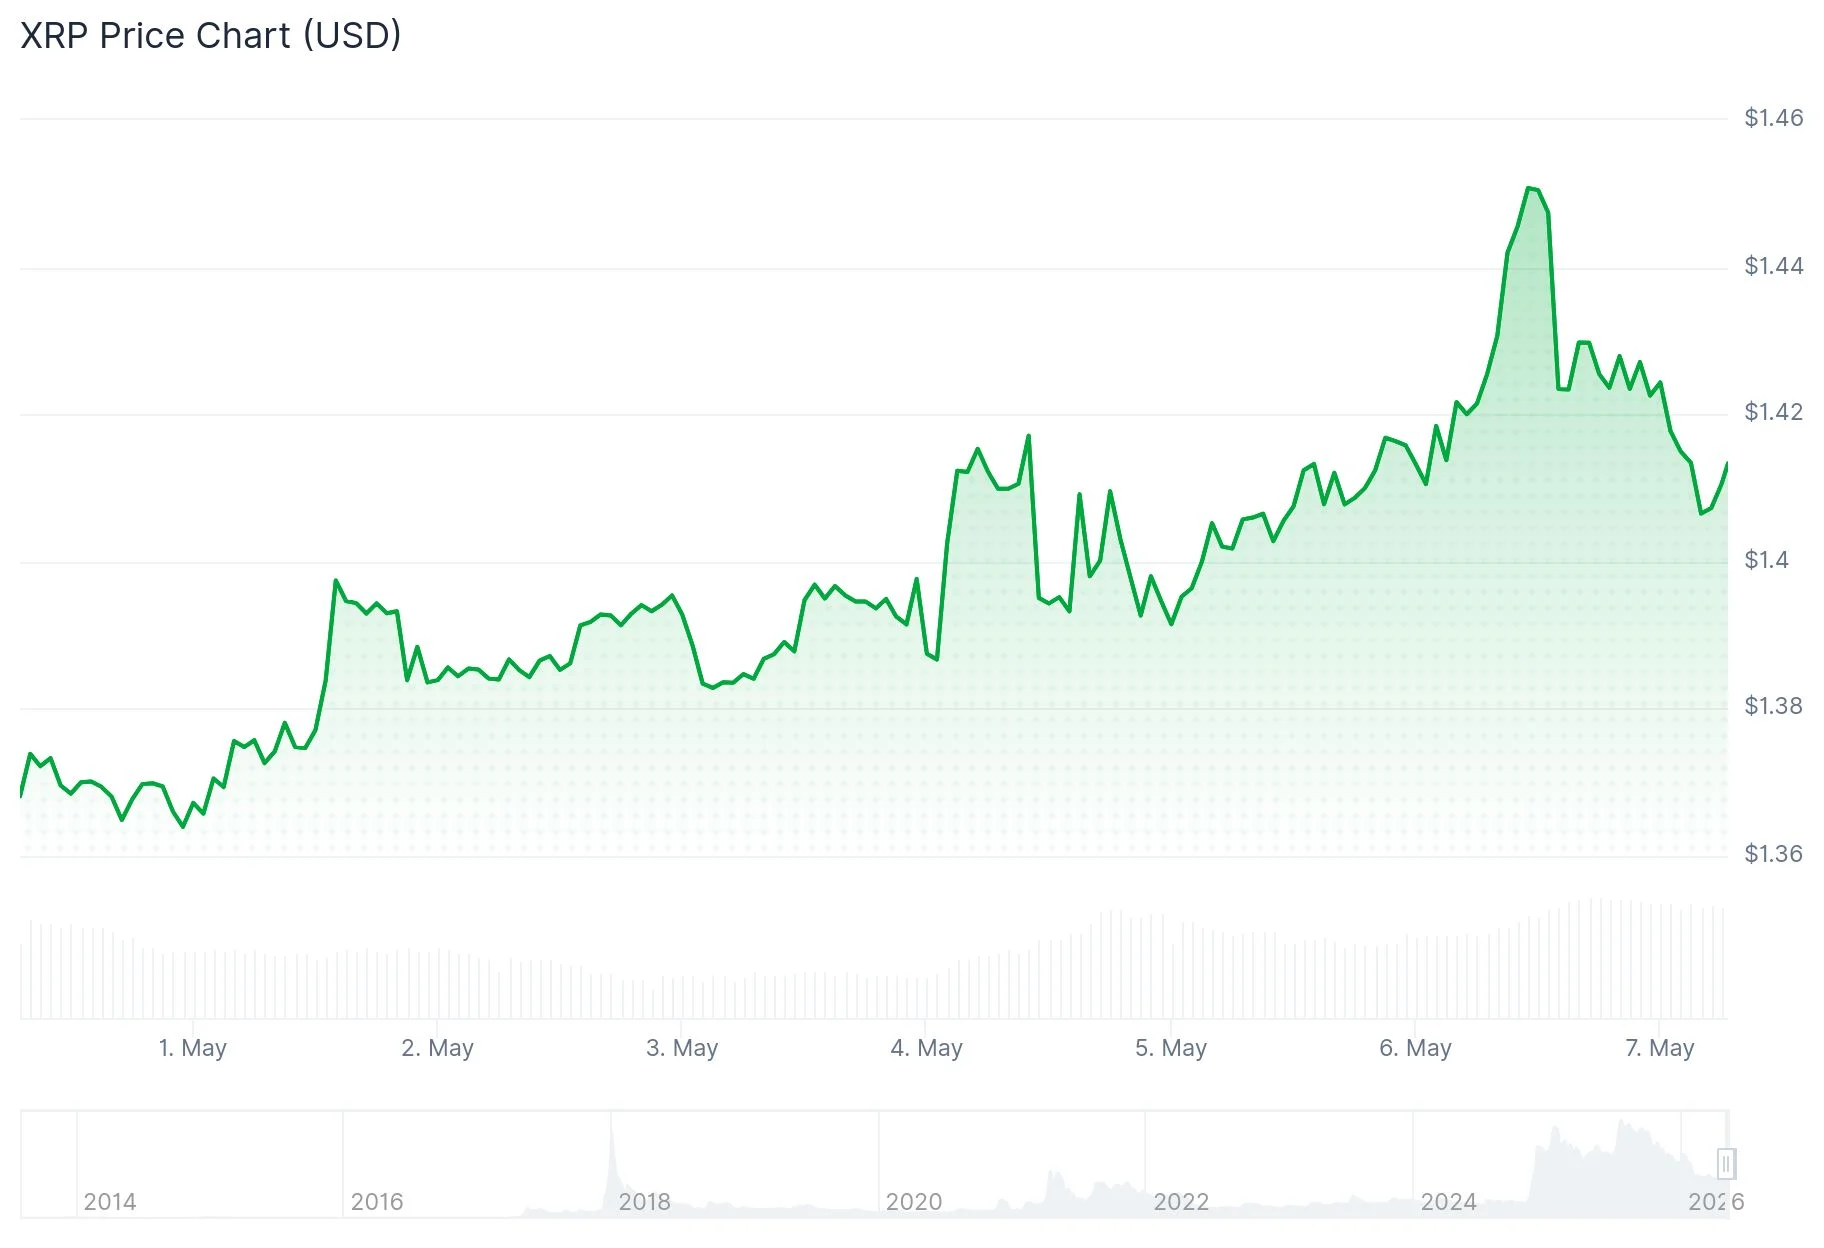
XRP, recognized for facilitating efficient international transfers through rapid settlement times and minimal transaction costs, currently maintains trading activity between $1.43 and $1.45. While the recent 24-hour period delivered a moderate 1.2% advance, the developing chart architecture presents a more compelling narrative.
The digital asset has established consolidation above the middle Bollinger Band across daily intervals. This technical level has provided dynamic price support, maintaining bullish momentum throughout recent sessions. The upper Bollinger Band positioned at $1.46–$1.47 represents the next immediate hurdle requiring penetration.
MACD indicators demonstrate gradual momentum accumulation. Although a decisive breakout confirmation remains pending, preliminary signals suggesting bullish convergence are emerging. Trading volumes continue at measured levels, which technical analysts commonly interpret as accumulation behavior rather than selling pressure.
Harmonic Formation Signals Substantial Upside Potential
Chart analyst The_Alchemist_Trader_ has highlighted a developing Gartley harmonic configuration within XRP’s price structure. This pattern approaches its concluding C-D movement segment, and successful completion could project an upside objective near $2.64. The analyst emphasized: “The harmonic framework is entering its terminal phase, making preservation of existing support zones essential for pattern validation.” Any violation below present support boundaries would completely negate this technical scenario.
In parallel analysis, EGRAG CRYPTO has drawn attention to a contracting symmetrical triangle visible on daily charts. This classical formation typically precedes substantial directional price acceleration. EGRAG CRYPTO characterized the configuration as one that “may precipitate a powerful directional move following penetration of macro resistance barriers,” establishing an initial upside benchmark around $2.30. However, false breakout risks persist, where price could temporarily spike before reversing course.
Critical Price Thresholds Under Observation
The $1.44–$1.50 corridor has functioned as a persistent overhead supply area. A sustained daily close exceeding this boundary would establish pathways initially toward $1.60, followed by potentially elevated objectives. Conversely, $1.35 represents the essential support foundation. Violation of this threshold could drive price action toward $1.32.
The Relative Strength Index registers near 57 — positioned in neutral territory between overbought and oversold extremes. Shorter-duration moving averages maintain bullish alignment, while broader oscillator readings remain balanced. The daily chart exhibits a “Change of Character” formation, suggesting possible trend transition without yet confirming ultimate direction.
Regarding fundamental catalysts, Ripple has continued releasing updates concerning expanded participation in tokenized asset infrastructure and institutional cross-border payment systems utilizing the XRP Ledger. These strategic initiatives bolster longer-term market sentiment, though immediate price catalysts remain limited.
At current market levels, XRP is exchanging hands at approximately $1.45, positioned marginally beneath the pivotal $1.46–$1.47 resistance barrier.