

Key Takeaways
- A chart formation similar to early 2025 is developing on XRP, which previously resulted in a 66% price increase to $3.66
- Technical analysts are monitoring the bull flag breakout zone around $1.40 as a critical threshold
- Daily chart symmetrical triangle formation suggests potential movement toward $1.90, followed by $2.00
- Cumulative volume delta for spot takers turned positive May 1, indicating renewed buying pressure
- Open interest delta registered +$27 million on May 1, signaling new derivative market activity
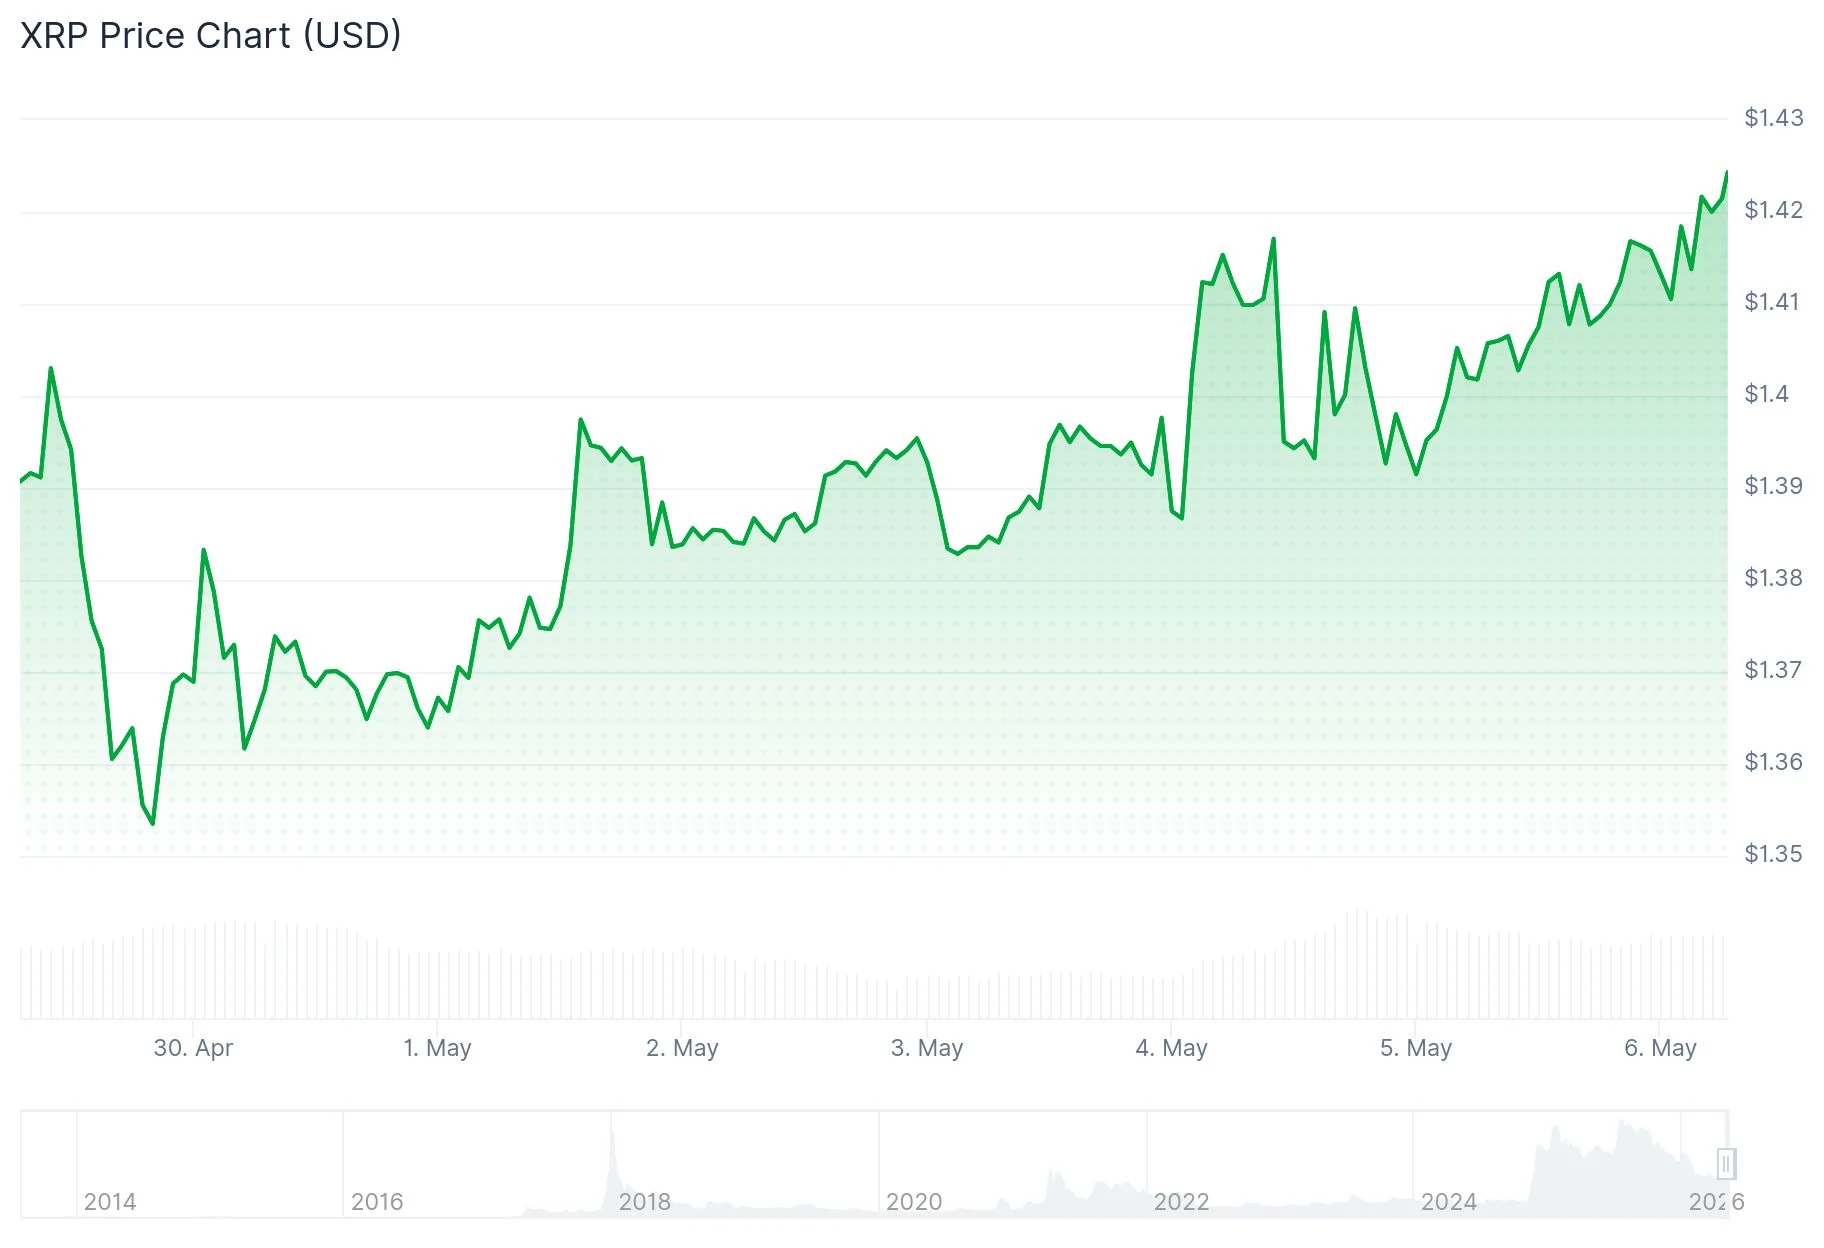
As of early May 2026, XRP is hovering in the $1.39–$1.41 range, entering a consolidation phase following tests of near-term resistance levels. Market technicians are noting striking parallels to a chart configuration that materialized during mid-2025.
The 2025 formation — characterized by a bull flag accompanied by a positive EMA alignment — catalyzed a 66% advance within a 14-day window, driving XRP from approximately $2.21 to its peak of $3.66.
Current market structure appears to be replicating this sequence. XRP has emerged from a comparable bull flag configuration, while the 20-day and 50-day exponential moving averages are approaching a constructive intersection.
Technical strategist Jack Straw observed Tuesday that XRP is “building upward pressure above the $1.40 threshold, maintaining support above its 100-hour simple moving average,” suggesting that “a decisive push beyond $1.420 may activate the subsequent advance.” Meanwhile, analyst Sam Mti identified a buy indication from the MTI metric, characterizing the arrangement as “showing promise” with capacity to touch $1.45 provided $1.40 remains intact.
Should the 66% historical pattern repeat from present price levels, projections point toward approximately $2.35.
Accumulation Evidence as CVD Shifts Positive
Among the most compelling on-chain indicators supporting bullish momentum is the 90-day spot taker cumulative volume delta (CVD) for XRP. This measurement calculates the net difference between aggressive buy volume and sell volume across a three-month period.
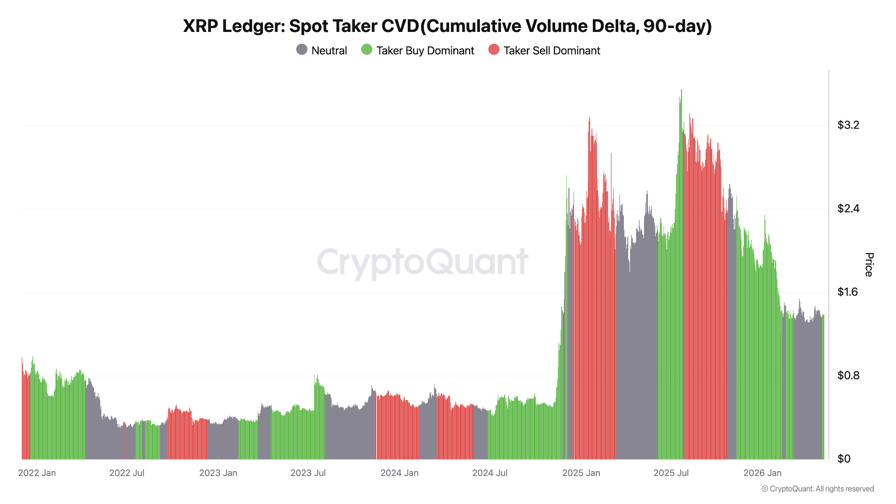
The indicator transitioned into positive territory on May 1, coinciding with XRP‘s move above the $1.38 resistance barrier. A comparable CVD reversal occurred in June 2025, which preceded a 70% appreciation.
CryptoQuant researcher Amr Taha drew attention to a pronounced positive spike in open interest delta, which registered $27 million on May 1. “This type of movement during an uptrend typically indicates traders are expanding positions as bullish momentum gains traction,” Taha explained.
Symmetrical Triangle Formation Suggests $1.90 Objective
Examining the daily timeframe reveals an additional symmetrical triangle pattern taking shape. This technical structure features two converging trendlines that squeeze price action until a directional breakout emerges.
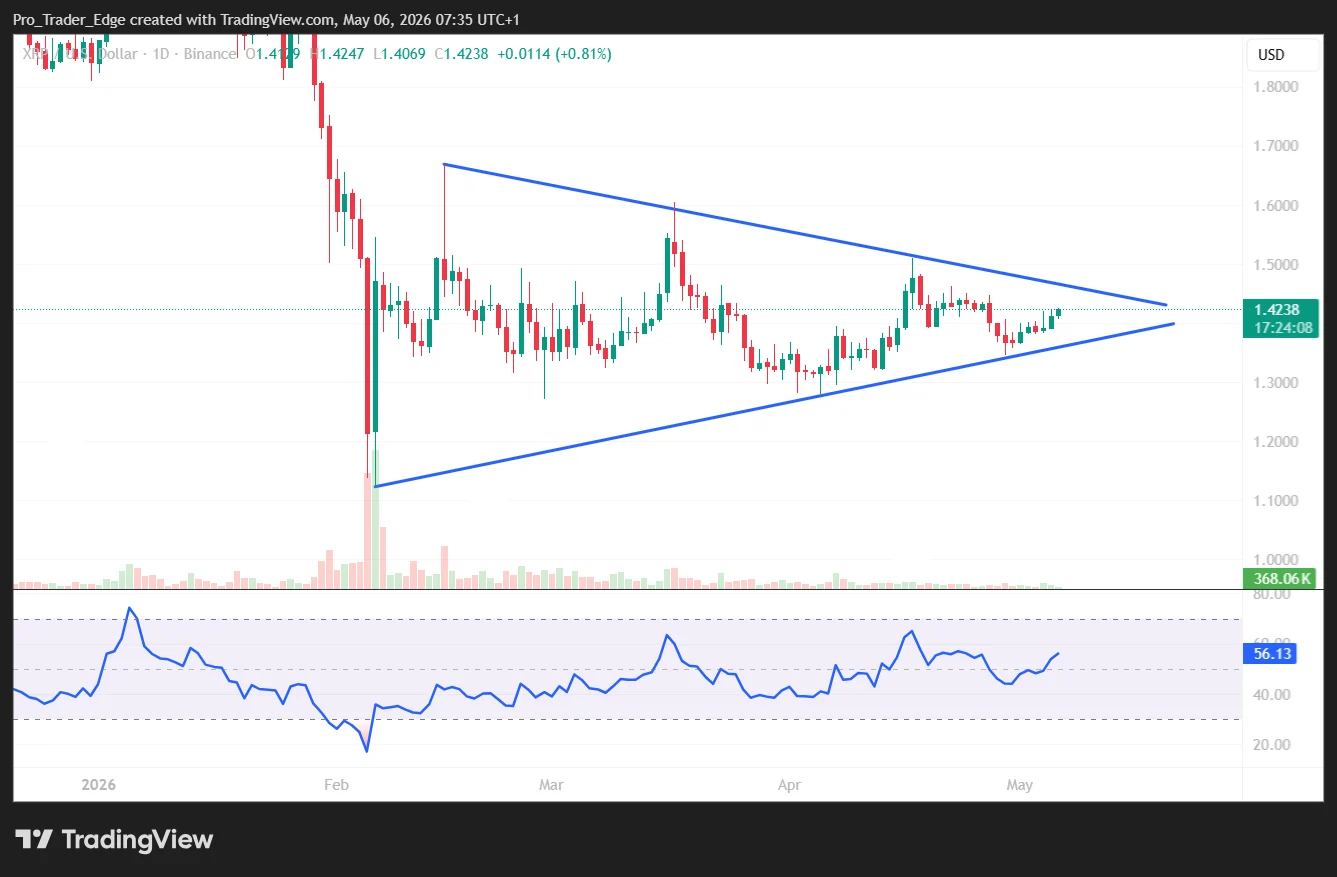
A verified breakout above $1.45 would confirm this pattern and establish a measured objective near $1.90 — calculated using the triangle’s vertical distance. Following that milestone, the $2.00 psychological barrier represents the subsequent resistance zone.
Supporting technical indicators are aligning favorably. The Supertrend oscillator has switched to a bullish signal, indicating directional momentum shift. The MACD indicator is approaching a positive crossover, which would provide additional confirmation for upside continuation.
Sustaining price action above $1.40 — representing both the bull flag’s resistance boundary and the 50-day simple moving average — remains essential for maintaining pattern validity.