

Quick Summary
- XRP currently sits between $1.43 and $1.45, posting approximately 1.2% gains over the past day
- Critical resistance zone established at $1.44–$1.50, while support maintains around $1.35
- Advanced Gartley harmonic formation approaching completion with calculated upside target of $2.64
- Symmetrical triangle pattern compressing on daily timeframe, suggesting significant directional move approaching
- Technical analyst EGRAG CRYPTO identifies initial breakout objective around $2.30 following resistance clearance
XRP continues to trade within a confined range as multiple technical formations develop simultaneously. Market analysts remain focused on potential breakout catalysts.
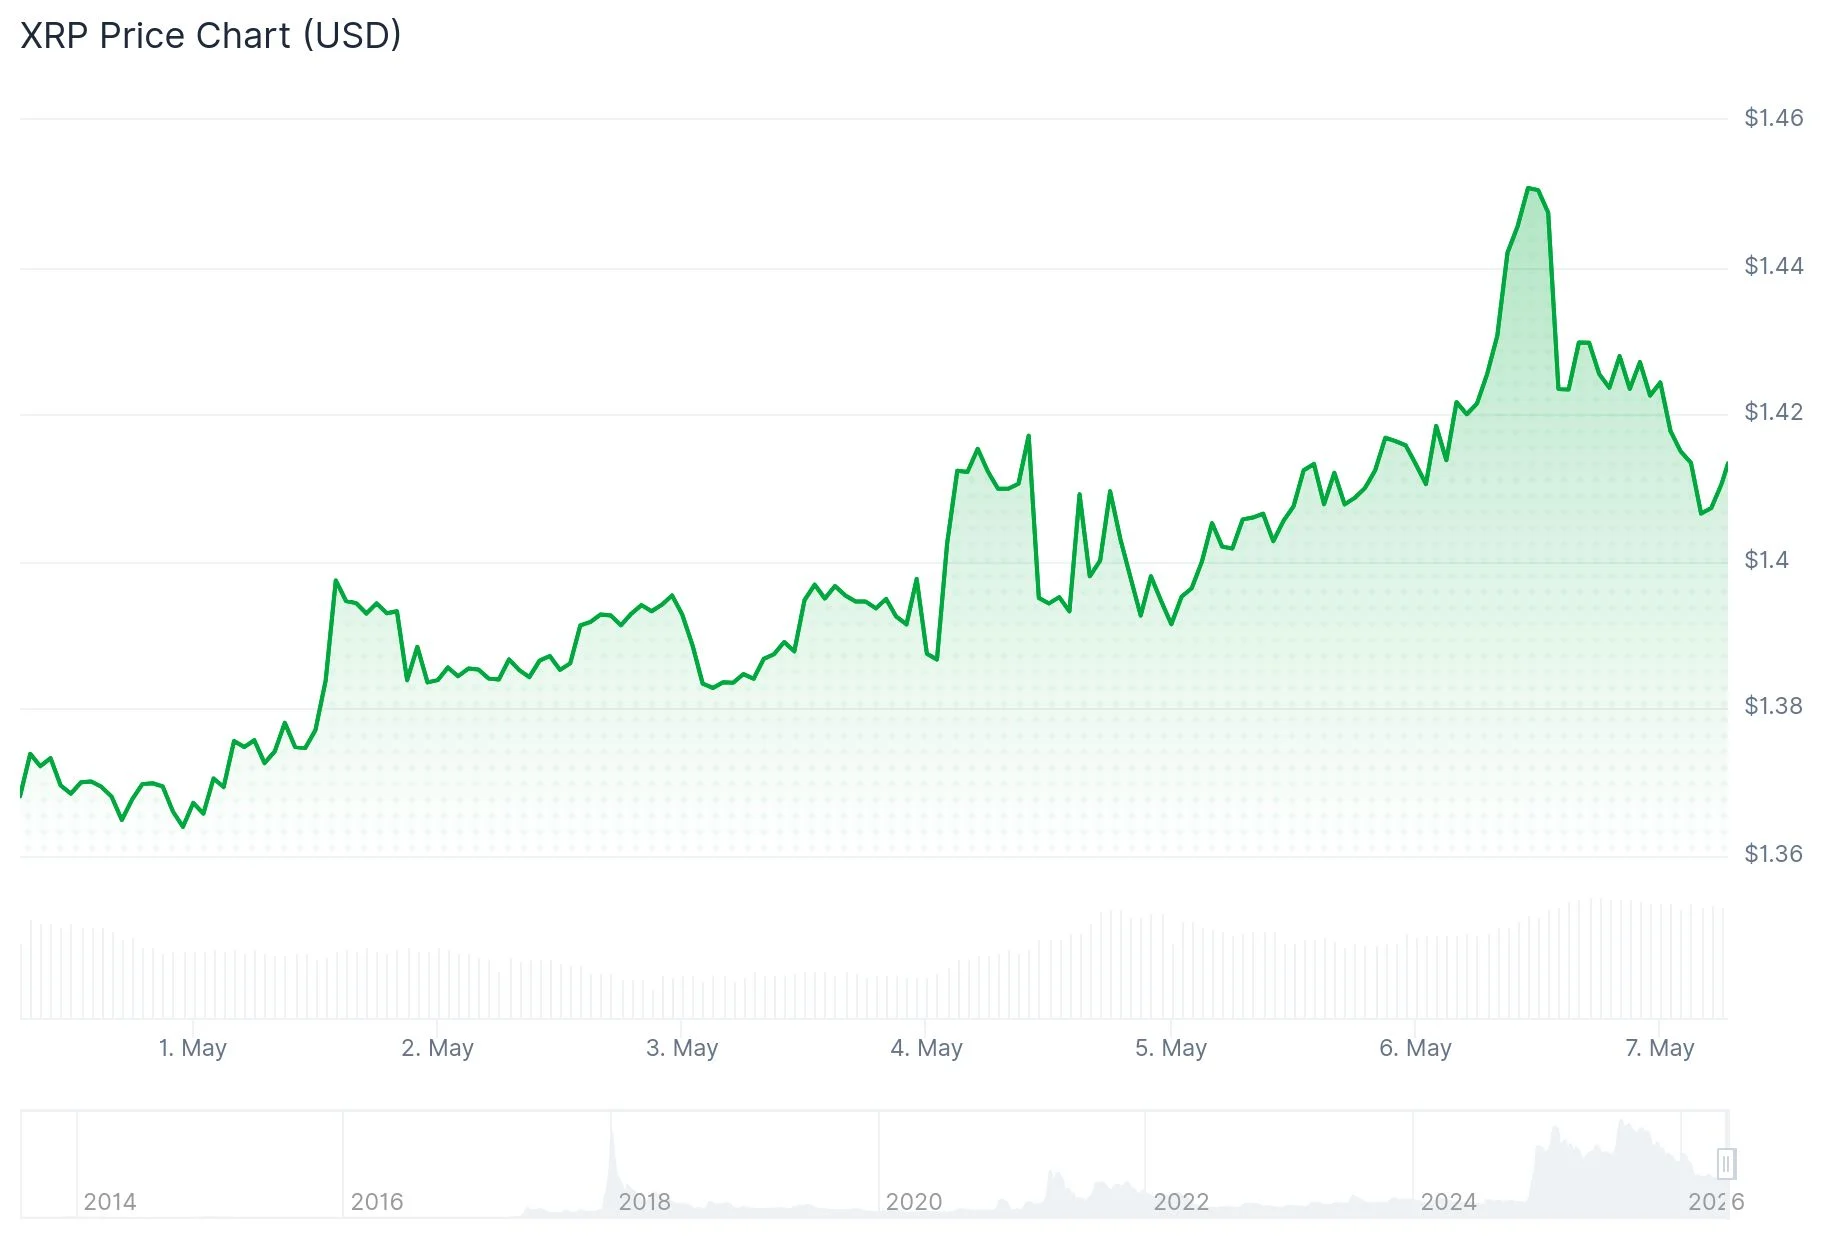
The digital asset, commonly utilized for international payment transfers thanks to its rapid settlement times and minimal transaction costs, currently maintains stability between $1.43 and $1.45. While the previous 24-hour period shows a moderate 1.2% increase, the developing chart structures present a more compelling narrative.
Price action has remained consolidated above the median Bollinger Band on the daily timeframe. This technical level has functioned as reliable dynamic support, maintaining bullish momentum for the time being. The upper Bollinger Band boundary at $1.46–$1.47 represents the immediate resistance threshold requiring penetration.
MACD indicators demonstrate gradual momentum accumulation. While a definitive breakout confirmation remains absent, preliminary signals of a potential bullish crossover are emerging. Current trading volume levels remain moderate, a characteristic analysts frequently interpret as accumulation behavior rather than selling pressure.
Harmonic Formation Suggests Substantial Upside Potential
Technical analyst The_Alchemist_Trader_ has spotted a Gartley harmonic configuration developing across the XRP chart. This pattern is progressing toward its concluding C-D phase, and upon successful completion, calculations project a potential target approaching $2.64. The analyst emphasized: “The harmonic structure is approaching its final phase, and holding the current support zone is critical for continuation.” Should price action fail to maintain the existing support area, this technical setup would become invalidated.
In a separate analysis, crypto market observer EGRAG CRYPTO highlighted a contracting symmetrical triangle formation visible on the daily chart. These technical patterns characteristically precede substantial price movement in either direction. EGRAG CRYPTO observed the configuration “could lead to a strong breakout once macro resistance levels are cleared,” establishing an initial objective near $2.30. Traders should remain aware that false breakouts represent a legitimate concern, where price might temporarily spike before reversing.
Critical Price Zones Under Observation
The $1.44–$1.50 territory has functioned as a persistent supply area. A validated close exceeding this threshold would establish pathways toward $1.60 initially, followed by potentially elevated targets. Conversely, $1.35 represents the crucial support baseline. A breach below this level could drive price action toward $1.32.
The Relative Strength Index currently registers near 57 — positioned in neutral territory between overbought and oversold conditions. Shorter-timeframe moving averages display bullish alignment, while oscillator readings maintain overall neutrality. The daily chart exhibits a “Change of Character” formation, indicating a possible trend shift without confirming ultimate directional bias.
Regarding fundamental developments, Ripple has published announcements concerning expanded participation in tokenized asset initiatives and institutional cross-border payment infrastructure utilizing the XRP Ledger. These fundamental catalysts bolster long-term market sentiment, although their capacity to generate immediate price reactions remains limited.
At the current moment, XRP is exchanging hands at approximately $1.45, positioned directly beneath the significant $1.46–$1.47 resistance barrier.