
 Eyes Breakout as Institutional Interest Surges Past $1 Billion")
Key Takeaways
- Solana is currently trading at $85.95, maintaining position above the 20-day EMA at $85.31, while facing resistance at the 50-day EMA of $87.08 throughout March.
- A breakout above a multi-month descending trendline has occurred on the daily timeframe, with SOL now retesting this level as potential support.
- Weekly technical analysis indicates the $120–$125 range as the next significant resistance zone if current downtrend breaks decisively.
- Real-world asset (RWA) integration on Solana exploded from $170M to $2B over the past year, supported by 80–100M active wallets and $17B stablecoin liquidity.
- Cumulative SOL spot ETF inflows have surpassed the $1B threshold for the first time, with net assets totaling $887.92M.
As of April 23, Solana is changing hands at $85.95, representing a 1.10% decline over the past 24 hours. The cryptocurrency has successfully maintained its position above the 20-day exponential moving average (EMA) at $85.31, which has provided reliable support over the last seven trading days.
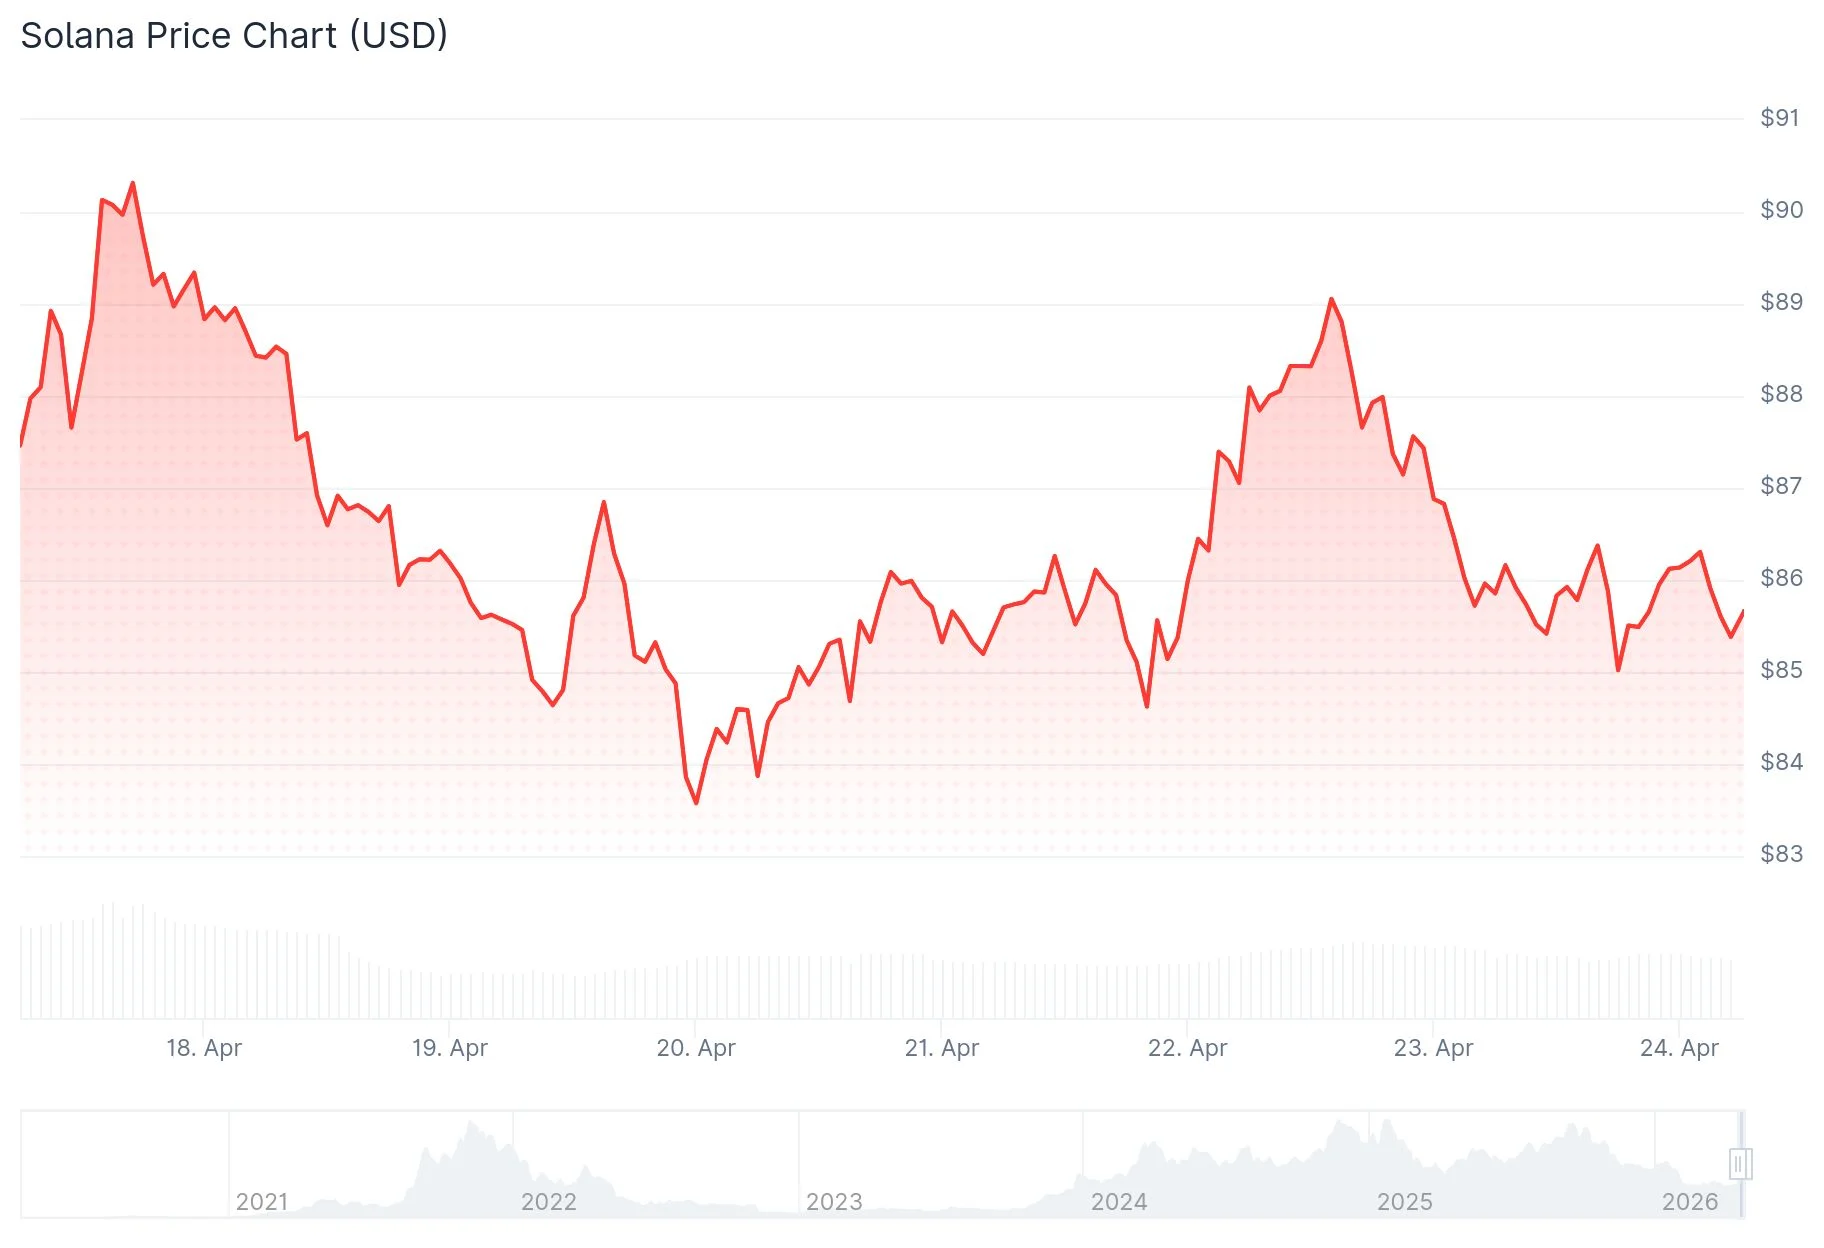
The primary resistance barrier remains at the 50-day EMA, currently positioned at $87.08. Since early March, each daily closing price has been turned away at or beneath this technical level. The upper Bollinger Band is located at $89.43, while the 100-day EMA extends further to $96.63.
Should SOL lose its grip on the 20-day EMA with a confirmed daily close below, traders would be watching the middle Bollinger Band at $84.63 as the next support level. Further downside would encounter the lower Bollinger Band at $79.84, with the February bottom stationed around $67.
Examining the daily timeframe reveals that SOL has successfully breached a descending trendline that capped upward movement throughout late 2025 and into early 2026. Technical assessment from CryptoCurb on X highlights this breakout occurring after multiple unsuccessful attempts, including during the Binance flash crash event and Iran conflict escalation phases.
The current price action shows SOL consolidating near the breakout level instead of reversing below it. This represents a meaningful change in market structure. However, this bullish configuration gains strength only if buyers successfully defend this zone and transform the broken trendline into reliable support.
Institutional Capital Accelerates Into Solana
According to Solana ecosystem executive Nick Ducoff, real-world asset tokenization on the platform surged from $170M to $2B within a single year — marking an approximate 12-fold expansion. Institutional participants have highlighted three primary drivers: consistent network performance, a distribution network of 80 to 100 million active wallets, and $17B worth of stablecoins already deployed on the blockchain.
Cumulative inflows into SOL spot exchange-traded funds have exceeded $1B for the first time since launch. Current total net assets stand at $887.92M, representing 1.77% of Solana’s overall market capitalization. The previous week recorded $35.17M in ETF inflows. While April 22 saw zero daily inflow activity, the preceding three trading days collectively contributed $31.32M.
Weekly Timeframe Targets $120–$125 Zone
Analyzing the weekly chart, technical commentary from Rendoshi AI on X identifies SOL testing a falling trendline after successfully defending support in the $75–$80 region. The Relative Strength Index has rebounded from near oversold territory, suggesting improving momentum dynamics, though this alone doesn’t constitute confirmation of a sustained breakout.
Should SOL decisively break and maintain levels above the weekly downtrend line, the subsequent major resistance zone lies between $120 and $125. Failure to sustain higher levels would leave SOL consolidating above the $75–$80 support area without establishing a clear recovery trajectory.
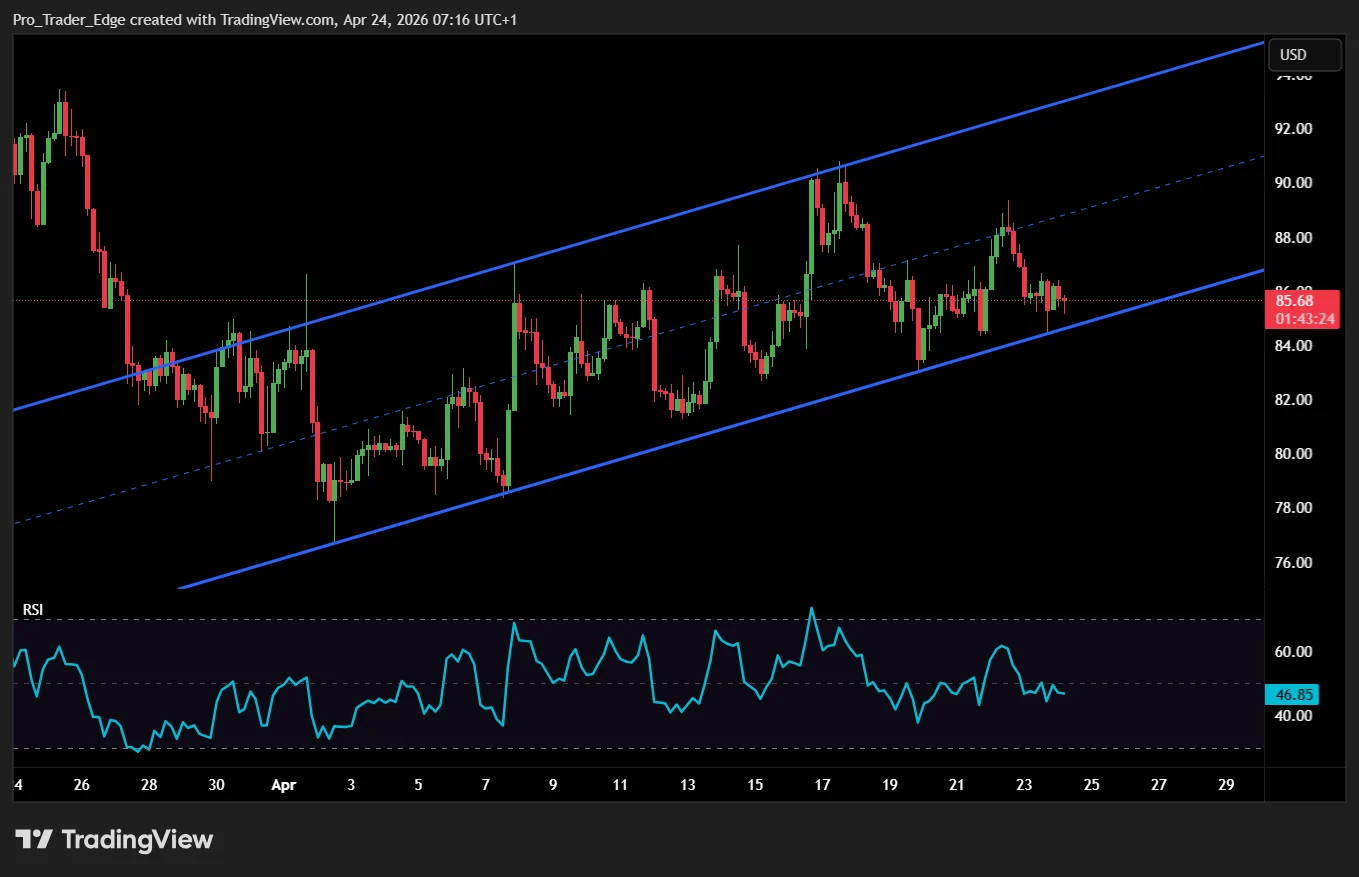
On the 2-hour timeframe, Solana is moving within an ascending channel formation that originated from the April 2 low around $78. The RSI indicator is displaying a fresh bullish signal at the recent low near $83 — a pattern that preceded previous upward movements. The MACD remains in negative territory at -0.25, indicating momentum has not yet validated the signal.
The lower boundary of the 2-hour ascending channel at $83–$84 coincides with the daily 20-day EMA, establishing this zone as the most critical support area to monitor heading into April 24.