
 Eyes 30% Surge as Key $90 Support Holds Strong")
Quick Overview
- Solana currently trades between $89 and $90, with buyers actively defending this critical threshold.
- A successful breakout above $90 resistance could drive prices toward $120, representing approximately 30% upside.
- Monthly trading volume increased 30%, momentarily touching the $5 billion threshold.
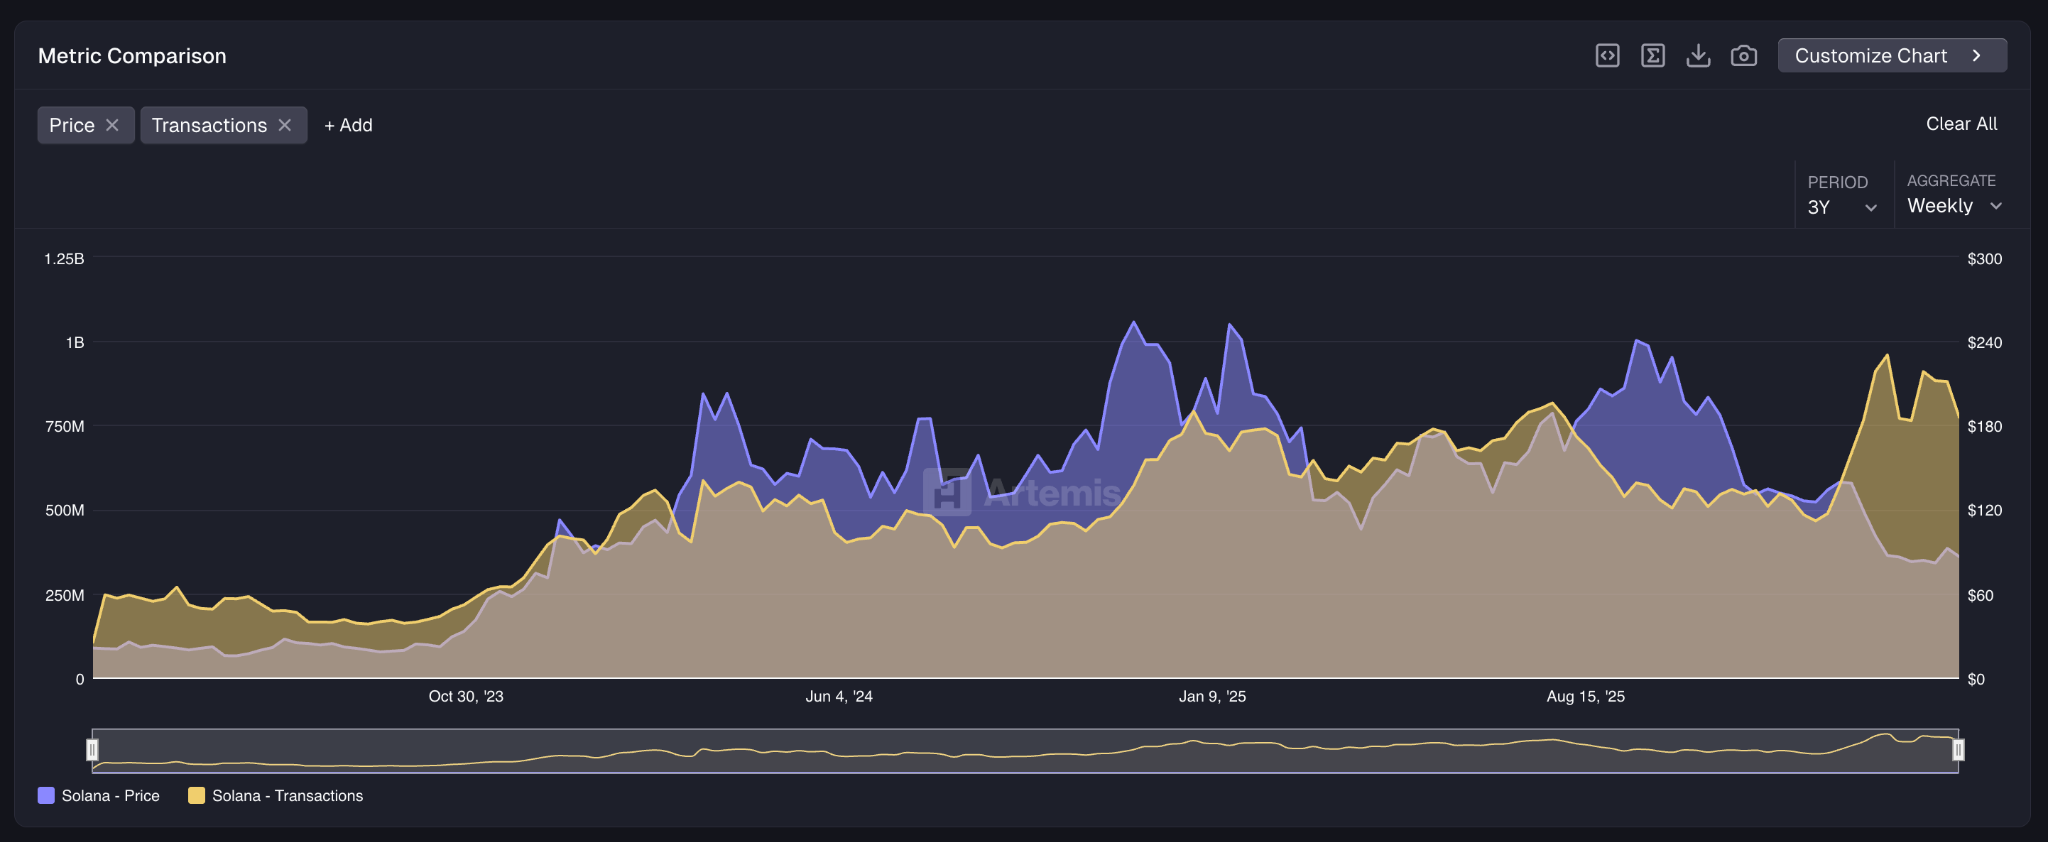
- Network transaction activity declined 20% from its latest high, indicating reduced on-chain engagement.
- Technical analyst Crypto Patel identifies a monthly bullish engulfing pattern as a critical indicator for potential explosive growth.
Solana continues to maintain stability around the $90 price point as market participants battle over this pivotal level. The next several trading sessions will likely determine whether the asset advances higher or retreats to lower support zones.
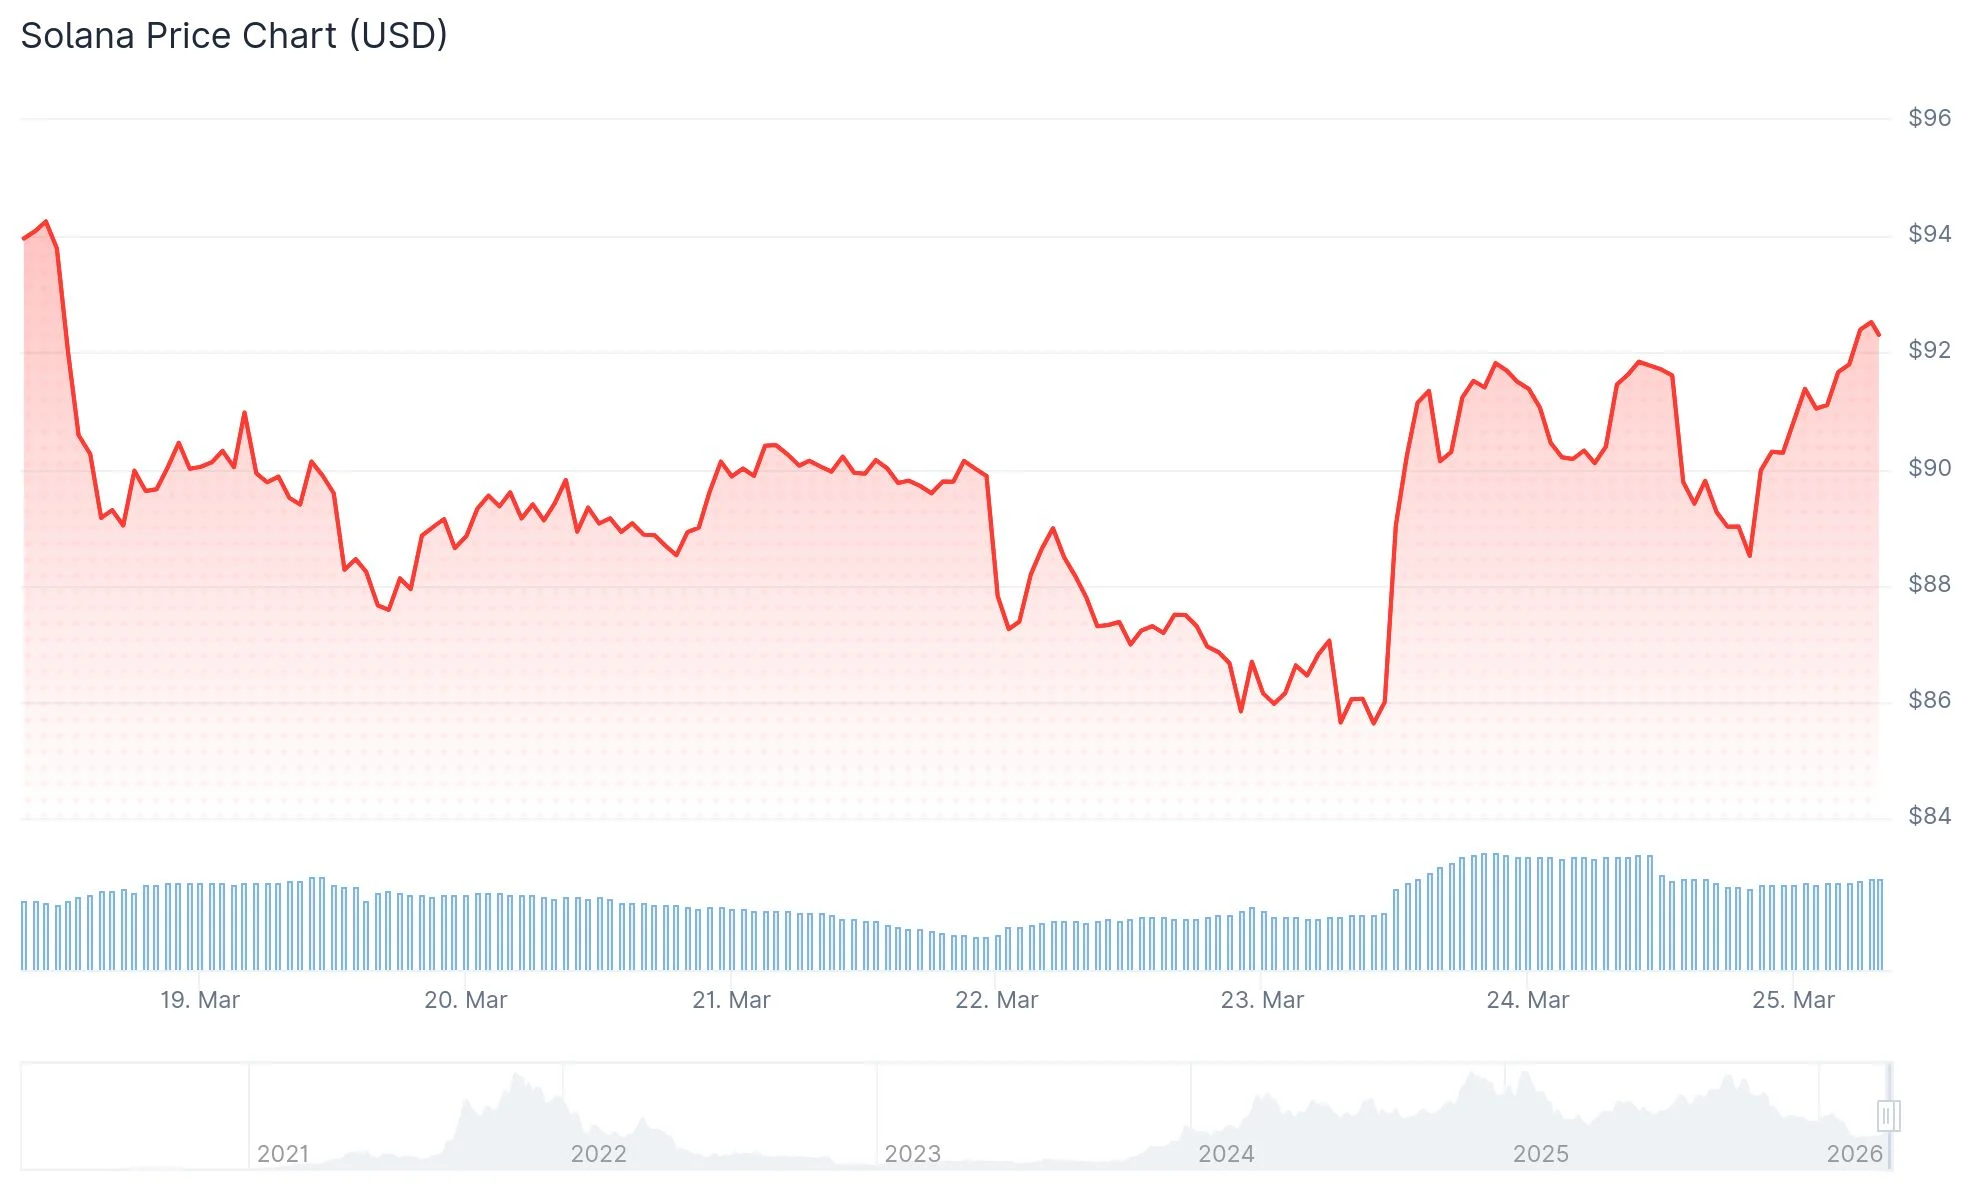
SOL has appreciated nearly 7% throughout the last 30 days and currently trades just beneath the $90 resistance threshold. Trading activity surged 30% during this timeframe, approaching the $5 billion mark, which represents roughly 10% of the token’s circulating supply valuation.
President Donald Trump’s announcement to temporarily halt U.S. military operations against Iranian energy infrastructure provided a tailwind for cryptocurrency markets early in the week. This development momentarily propelled SOL beyond $90, though sellers subsequently prevented sustained gains above this barrier.
Liquidation records indicate that more than $370 million in bearish positions were eliminated during that temporary upward movement. Should buying momentum persist, an even larger short squeeze scenario could materialize.
The daily timeframe reveals the Relative Strength Index (RSI) positioned at 54, following a brief spike above 60 during the previous week. This configuration indicates strengthening momentum that has yet to achieve a decisive breakout.
Critical Price Thresholds Under Observation
Should SOL decisively penetrate the $90 barrier, the immediate objective becomes $100, representing an 11% advancement. Maintaining momentum past that milestone could propel the asset to $120, delivering a 30% return from present valuations.
Examining the 4-hour timeframe reveals a buy indication emerging precisely as SOL tested $90, implying institutional capital is accumulating at this price point. This development reinforces the technical significance of the $90 level.
Conversely, should bearish forces intensify, SOL might retreat to $85 or potentially $80. The magnitude of any downward correction would depend on the intensity of selling pressure.
Blockchain Metrics and Monthly Chart Patterns
Blockchain analytics from Artemis indicate Solana processed 774 million transactions during the previous week. This figure represents a 20% decline from the recent peak, suggesting diminished network utilization.
The Fear and Greed Index has rebounded from an extreme reading of 5 to a neutral 46, demonstrating that investors are emerging from panic conditions, although overall sentiment remains measured.
Analyzing the monthly timeframe, technical expert Crypto Patel has identified a noteworthy formation. He observes that each significant SOL price surge historically commenced with a monthly bullish engulfing candlestick pattern.
Historical precedents include Solana climbing from $1.03 to $260 throughout 2020 and ascending from $8 to $296 during 2022. Patel projects that a comparable pattern forming in 2026 could potentially drive SOL toward $1,000 or higher.
Present technical readings present a mixed picture. The monthly RSI registers at 35.44, while SOL trades beneath all significant moving averages, including the $104, $111, $152, and $160 levels.
The MACD indicator currently shows -1.26, positioned below its signal line at -20.88, with a bearish histogram, indicating ongoing near-term downward pressure.
As of this analysis, SOL is valued at $89.33, accompanied by $6.95 billion in 24-hour trading volume and commanding a $51.64 billion market capitalization.