
 Consolidates Near $88 as Traders Eye Critical $100 Breakout Level")
Key Takeaways
- SOL currently trades around $87–$88, maintaining support above its 50-day EMA with resistance between $90 and $94
- Technical analyst Ali Martinez identifies a narrow Bollinger Band compression ranging from $77 to $94 on the 3-day timeframe
- Solana ETFs accumulated $9.44 million in net inflows last week, contributing to five consecutive positive days totaling approximately $1.45 billion
- Goldman Sachs revealed holdings of roughly $108 million in SOL
- A decisive breakout above $94 could trigger momentum toward $100; failure to hold $77 may signal further downside
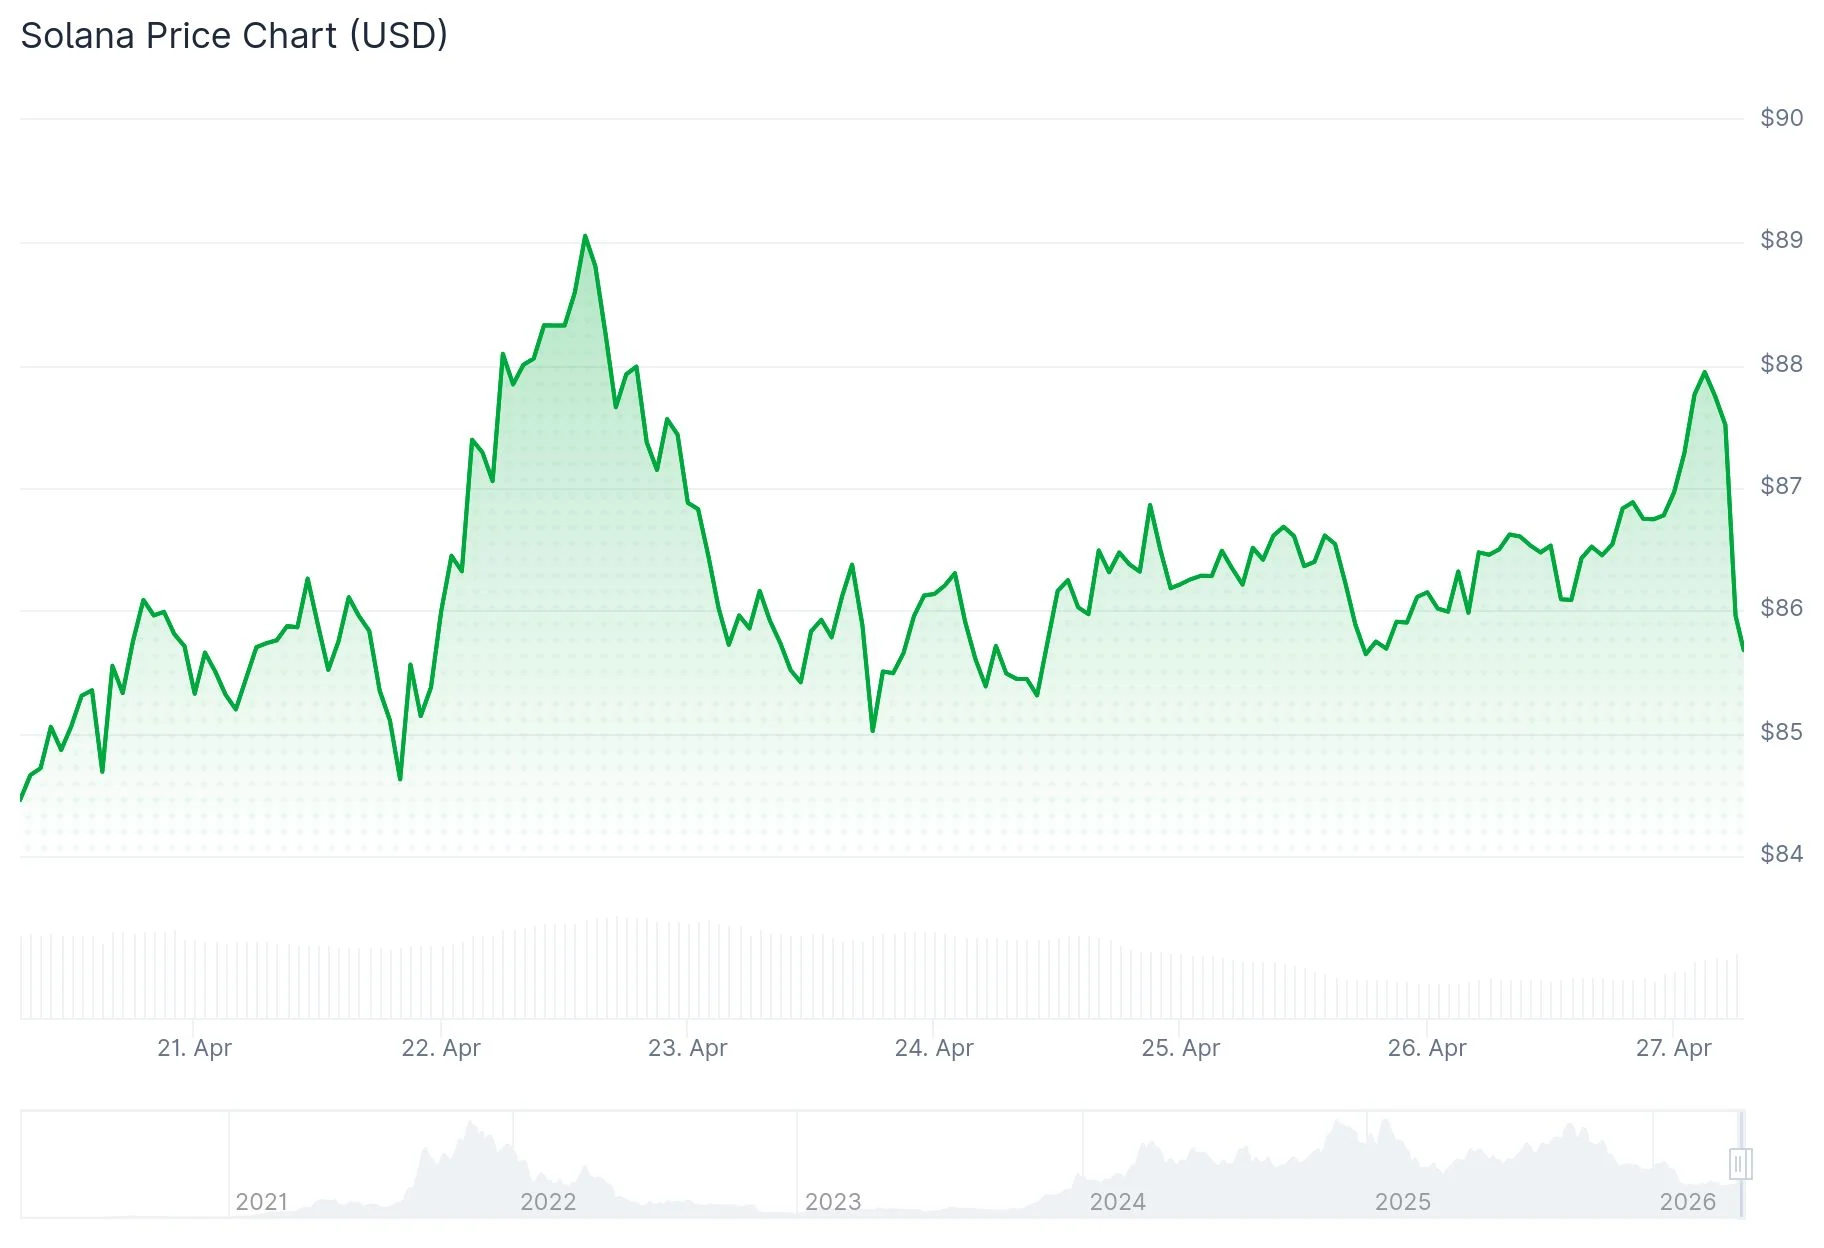
Solana (SOL) is currently changing hands around the $87–$88 range this Monday, maintaining its position above the 50-day Exponential Moving Average (EMA) located at $87.04. The cryptocurrency has rebounded from a recent bottom near $84.55 and is now challenging a critical resistance area.
SOL has successfully pushed past the 50% Fibonacci retracement level calculated from the recent decline between $89.34 and $84.55. Technical charts reveal a bullish trend line developing with support established around $86.50 on the hourly timeframe.
The nearest resistance barrier stands at $88.20, corresponding with the 76.4% Fibonacci retracement level. Beyond that, significant resistance zones appear at $90 and subsequently $92.
Crypto analyst Ali Martinez pointed out that SOL is currently confined within a compressed Bollinger Band channel on the 3-day chart, ranging from $77 to $94. He characterized this area as a “no-trade zone,” cautioning that attempting to trade within this consolidation range often results in volatile whipsaws and losses. Martinez emphasized that traders should wait for a confirmed 3-day candle closure beyond these bands before considering any directional move as a genuine breakout.
Trading volume has declined by over 23% throughout this consolidation period. While reduced volume during sideways movement is typical, any breakout attempt above $94 will require substantial volume participation to validate a sustained rally toward the $100 milestone.
Technical Setup Shows Emerging Bullish Signals
The Relative Strength Index (RSI) currently registers at 55, climbing above the neutral 50 level on the daily timeframe. Both the MACD and its signal line have crossed into positive territory, indicating that buyers are currently in control.
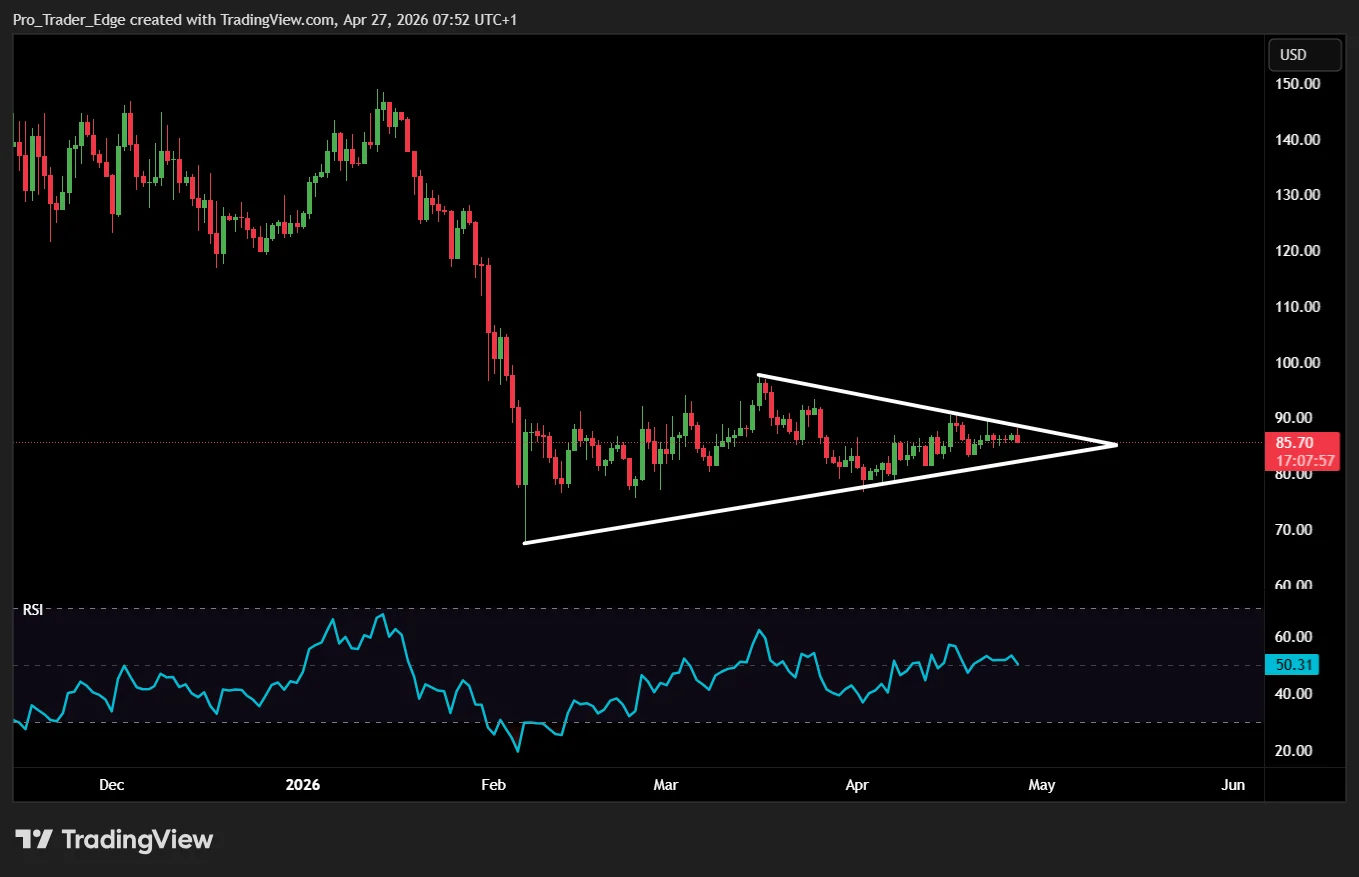
SOL is testing the upper resistance boundary of a symmetrical triangle formation near $89.00 on the daily chart. A convincing break above this technical level would bring the psychological $100 target into focus, followed by the 200-day EMA positioned at $113.
Regarding downside risks, the 50-day EMA at $87.04 represents the initial support level. A daily candle closing beneath the ascending trendline around $85.99 would compromise the current bullish structure.
Growing Institutional Participation and ETF Activity
Solana-focused exchange-traded funds registered $9.44 million in net inflows during the past week, down from $35.17 million the previous week. Despite the weekly slowdown, five straight days of positive inflows have accumulated to roughly $1.45 billion.
Goldman Sachs recently disclosed holdings worth nearly $108 million in Solana, representing another significant institutional endorsement that market participants are monitoring closely.
SOL futures Open Interest climbed more than 2% within 24 hours, reaching $5.23 billion. The funding rate jumped to 0.0095%, suggesting that traders are willing to pay elevated premiums to maintain long exposure.
Should SOL fail to penetrate the $90–$94 resistance zone, immediate support levels are located at $86.50, followed by $85. A breakdown below $78 could accelerate selling pressure toward the $72 region.