
 Struggles at $2,400: Critical Support Test Ahead")
Key Takeaways
- Ethereum declined 3.4% to $2,287 following a fourth consecutive rejection at the $2,400 threshold
- Technical charts reveal a triple top formation on daily timeframes, with critical support identified at $2,150
- Liquidation maps indicate over $2.5 billion in leveraged long positions vulnerable below the $2,150 mark
- ETH’s performance against Bitcoin weakened as the ETH/BTC ratio slipped beneath 0.032
- Higher timeframe analysis suggests accumulation phase activity, though confirmation remains pending
Ethereum’s price action has encountered persistent resistance at the $2,400 threshold, marking the fourth rejection since mid-April and establishing a recognizable triple top configuration on daily charts. Monday’s session saw ETH retreat 3.4% to settle at $2,287, extending a pattern of unsuccessful upward momentum.
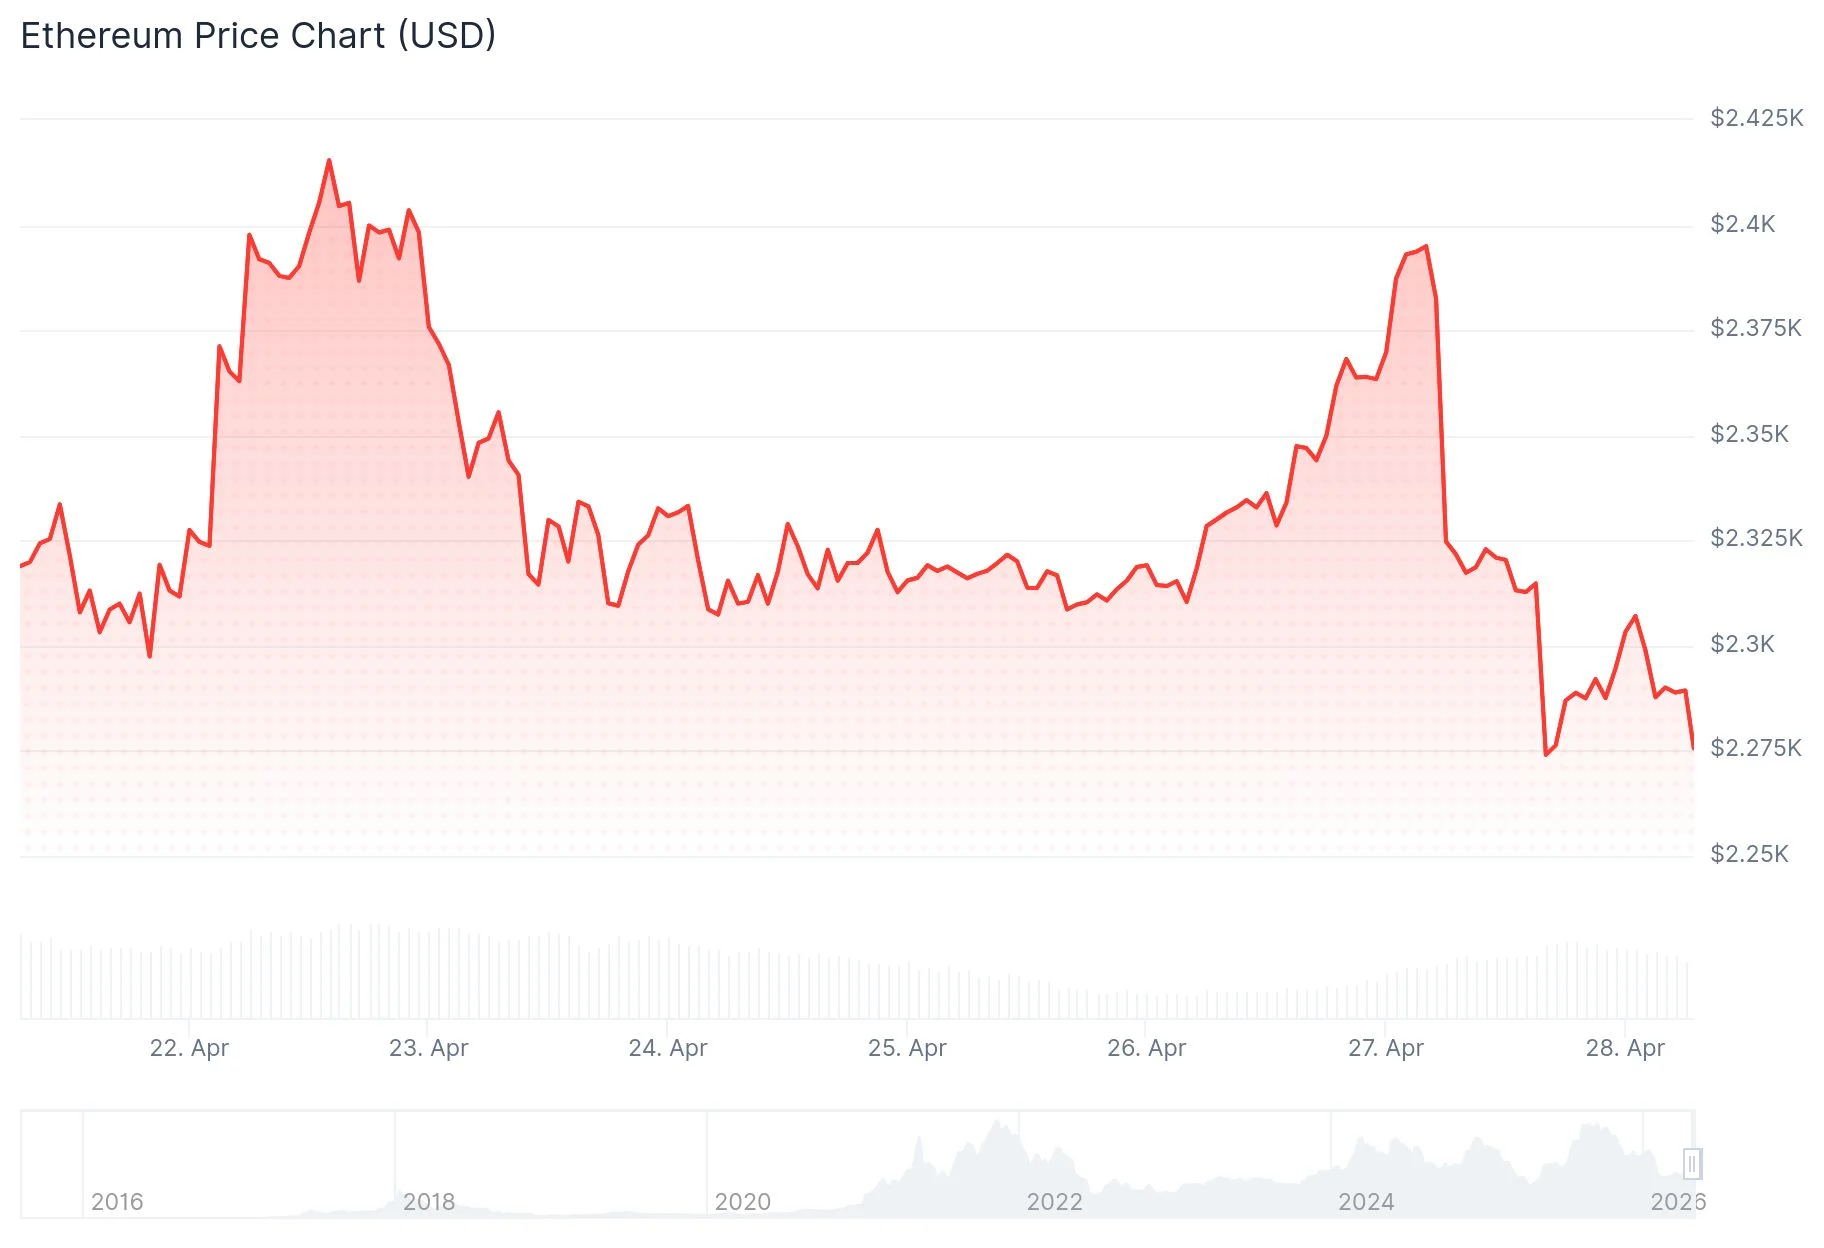
Technical indicators show the 100-day exponential moving average hovering around $2,350 has repeatedly served as dynamic resistance. ETH has consistently failed to secure a daily close above this moving average, limiting the duration and strength of recovery attempts.
Michaël van de Poppe, lead analyst at MN Capital, highlighted deteriorating performance in Ethereum’s Bitcoin pair. The ETH/BTC ratio breached the 0.032 BTC threshold, breaking through a support floor that had previously sustained upward movements. The ratio’s descent below its 21-period moving average further confirms diminishing relative strength compared to Bitcoin.
Analysts note that the next significant support level for the ETH/BTC trading pair appears around 0.026 BTC, a zone where buying interest had previously emerged.
Critical $2,150 Level Under Spotlight
Market participants are closely monitoring the $2,150 threshold as the primary defense line. This level underwent a technical flip from resistance to support and now represents a crucial juncture. A breakdown below this zone would likely expose the $2,050 to $1,900 price corridor to renewed selling pressure.
CoinGlass liquidation analytics reveal significant vulnerability, with approximately $2.5 billion in leveraged long positions clustered immediately below $2,150. A breach of this support could cascade into forced liquidations, amplifying downward price movement.
Binance data shows Ethereum’s open interest has contracted to $2.58 billion, mirroring levels observed when ETH traded around $2,200 earlier in the month. The funding rate has dropped to approximately -0.013%, reaching its most negative reading since February, indicating short positions have gained dominance in recent trading activity.
Analyst Amr Taha highlighted that this configuration—reduced leverage paired with short-heavy positioning—creates conditions conducive to a potential short squeeze if ETH maintains support around current price levels.
Macro Timeframes Point to Accumulation Activity
Crypto analyst Patel presented a bi-weekly chart analysis on X, illustrating Ethereum positioned near the lower boundary of an extended rising channel. The $1,700 to $2,250 territory is characterized as a liquidity collection and accumulation area, a zone that has provided foundational support dating back to 2022.
Immediate overhead resistance is identified near $2,480, with subsequent resistance clustering in the $3,500 to $4,900 range, encompassing the previous cycle high territory around $4,876.
James Easton’s three-day chart analysis on X reveals a historical pattern where significant rallies have consistently followed pronounced retracements. A marker on the chart indicates the current 2026 low, suggesting Ethereum may be establishing another foundational base.
Both technical perspectives refrain from confirming an imminent bullish reversal. Ethereum would require sustained support within the accumulation zone and a recapture of the $2,480 level before strengthening the case for renewed upward momentum.
The $2,150 zone remains the focal point where technical support structure intersects with substantial liquidation risk on near-term charts.