
 Eyes $3,000 Breakout as Whale Wallets Surge to All-Time Highs")
Key Highlights
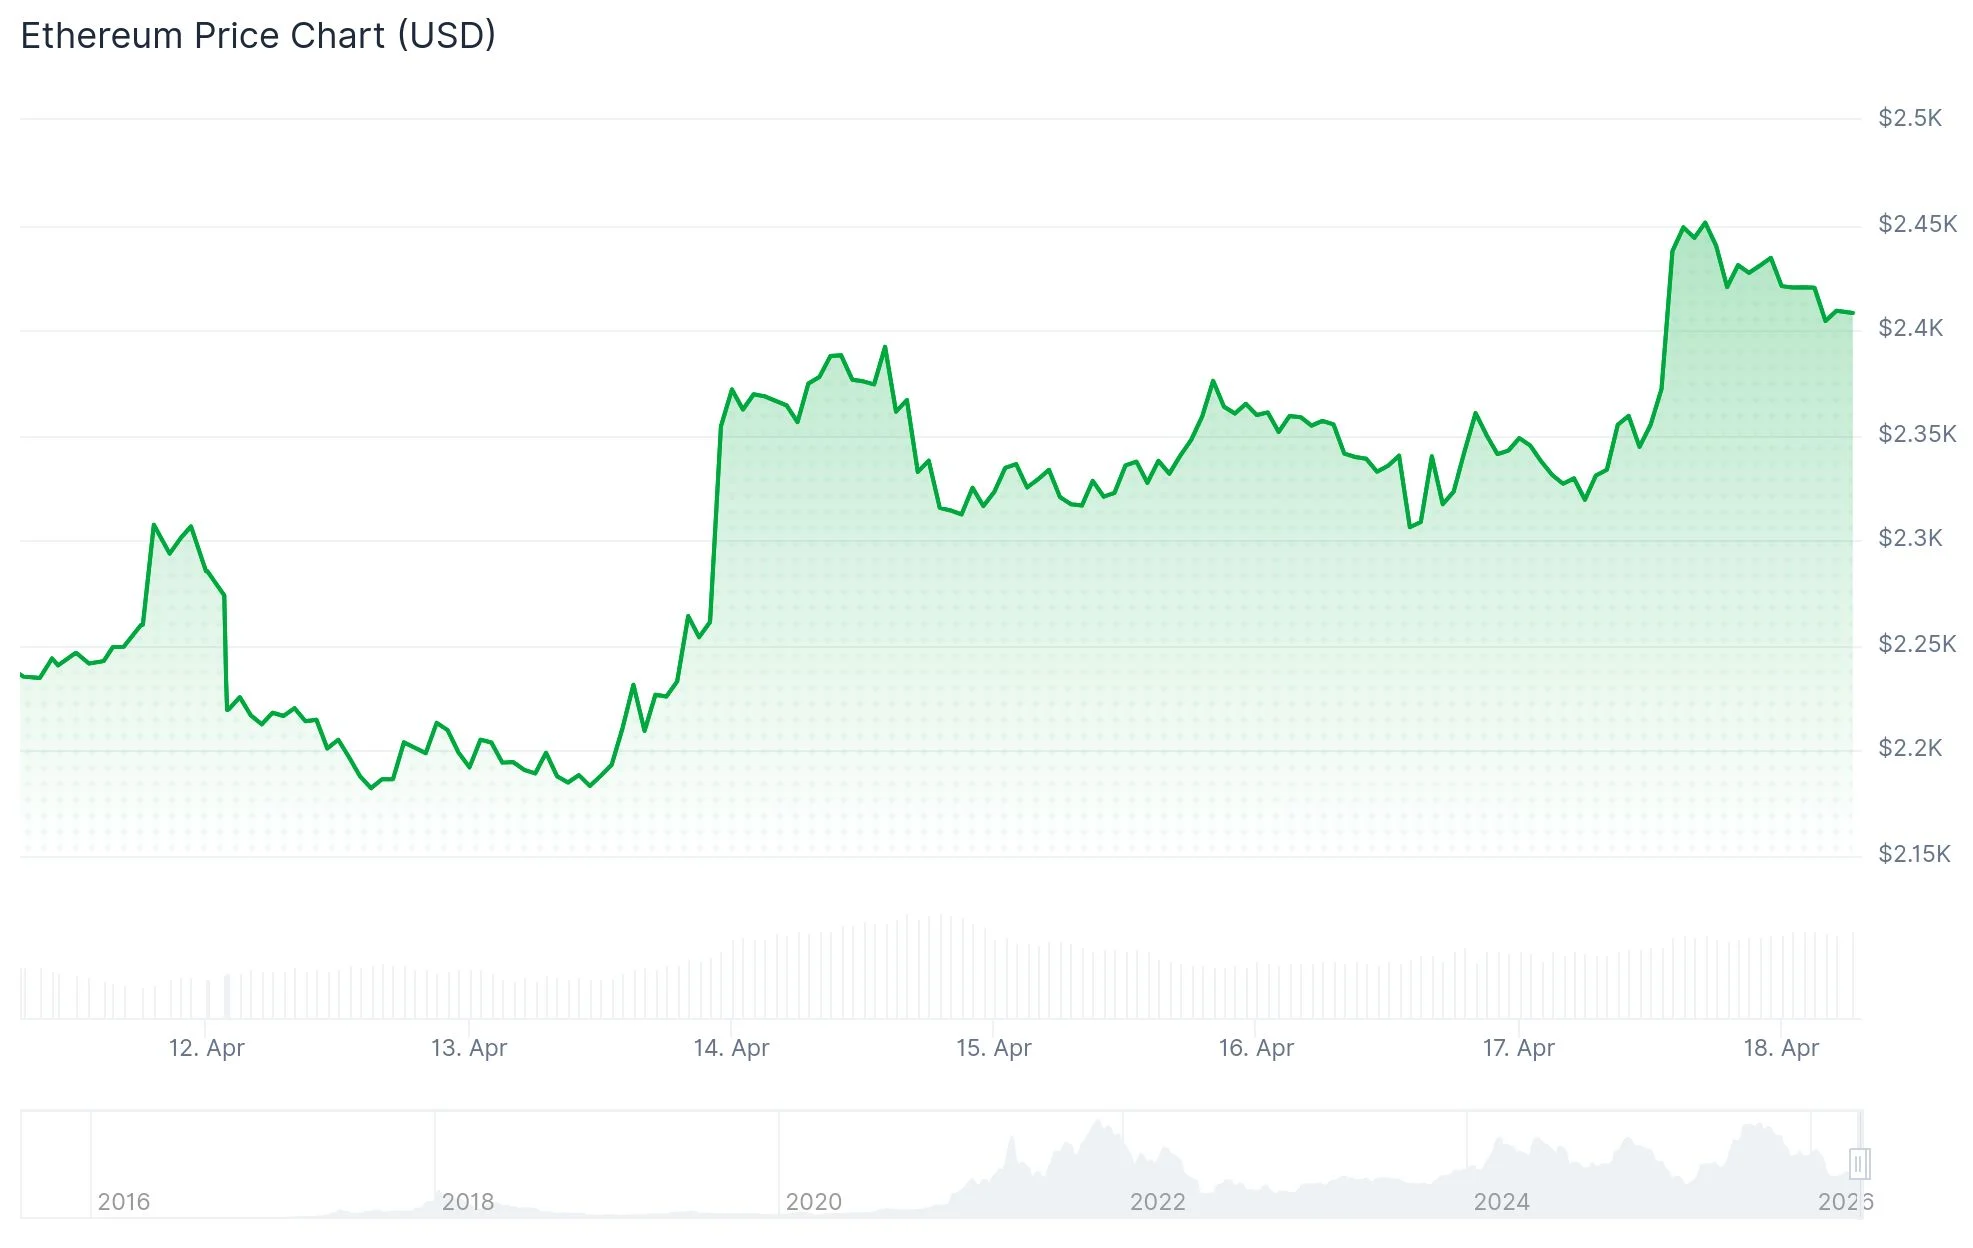
- ETH has surged past $2,400, marking a 38% increase from its $1,750 swing low
- Wallets focused on accumulation have increased their holdings by 33%, adding 6.5 million ETH since the start of the year
- Technical analysis reveals a cup-and-handle formation projecting prices toward $2,960–$3,150
- Ethereum spot ETFs have recorded seven straight days of positive inflows, amassing $298.4 million
- Easing Middle East tensions after Iran’s Strait of Hormuz announcement provided additional upward momentum for ETH
Ethereum has successfully breached the $2,400 level, extending a recovery that began from a low point of $1,750. This upward movement represents approximately a 38% gain from that recent bottom. Multiple on-chain metrics and technical signals are now capturing the attention of market participants.
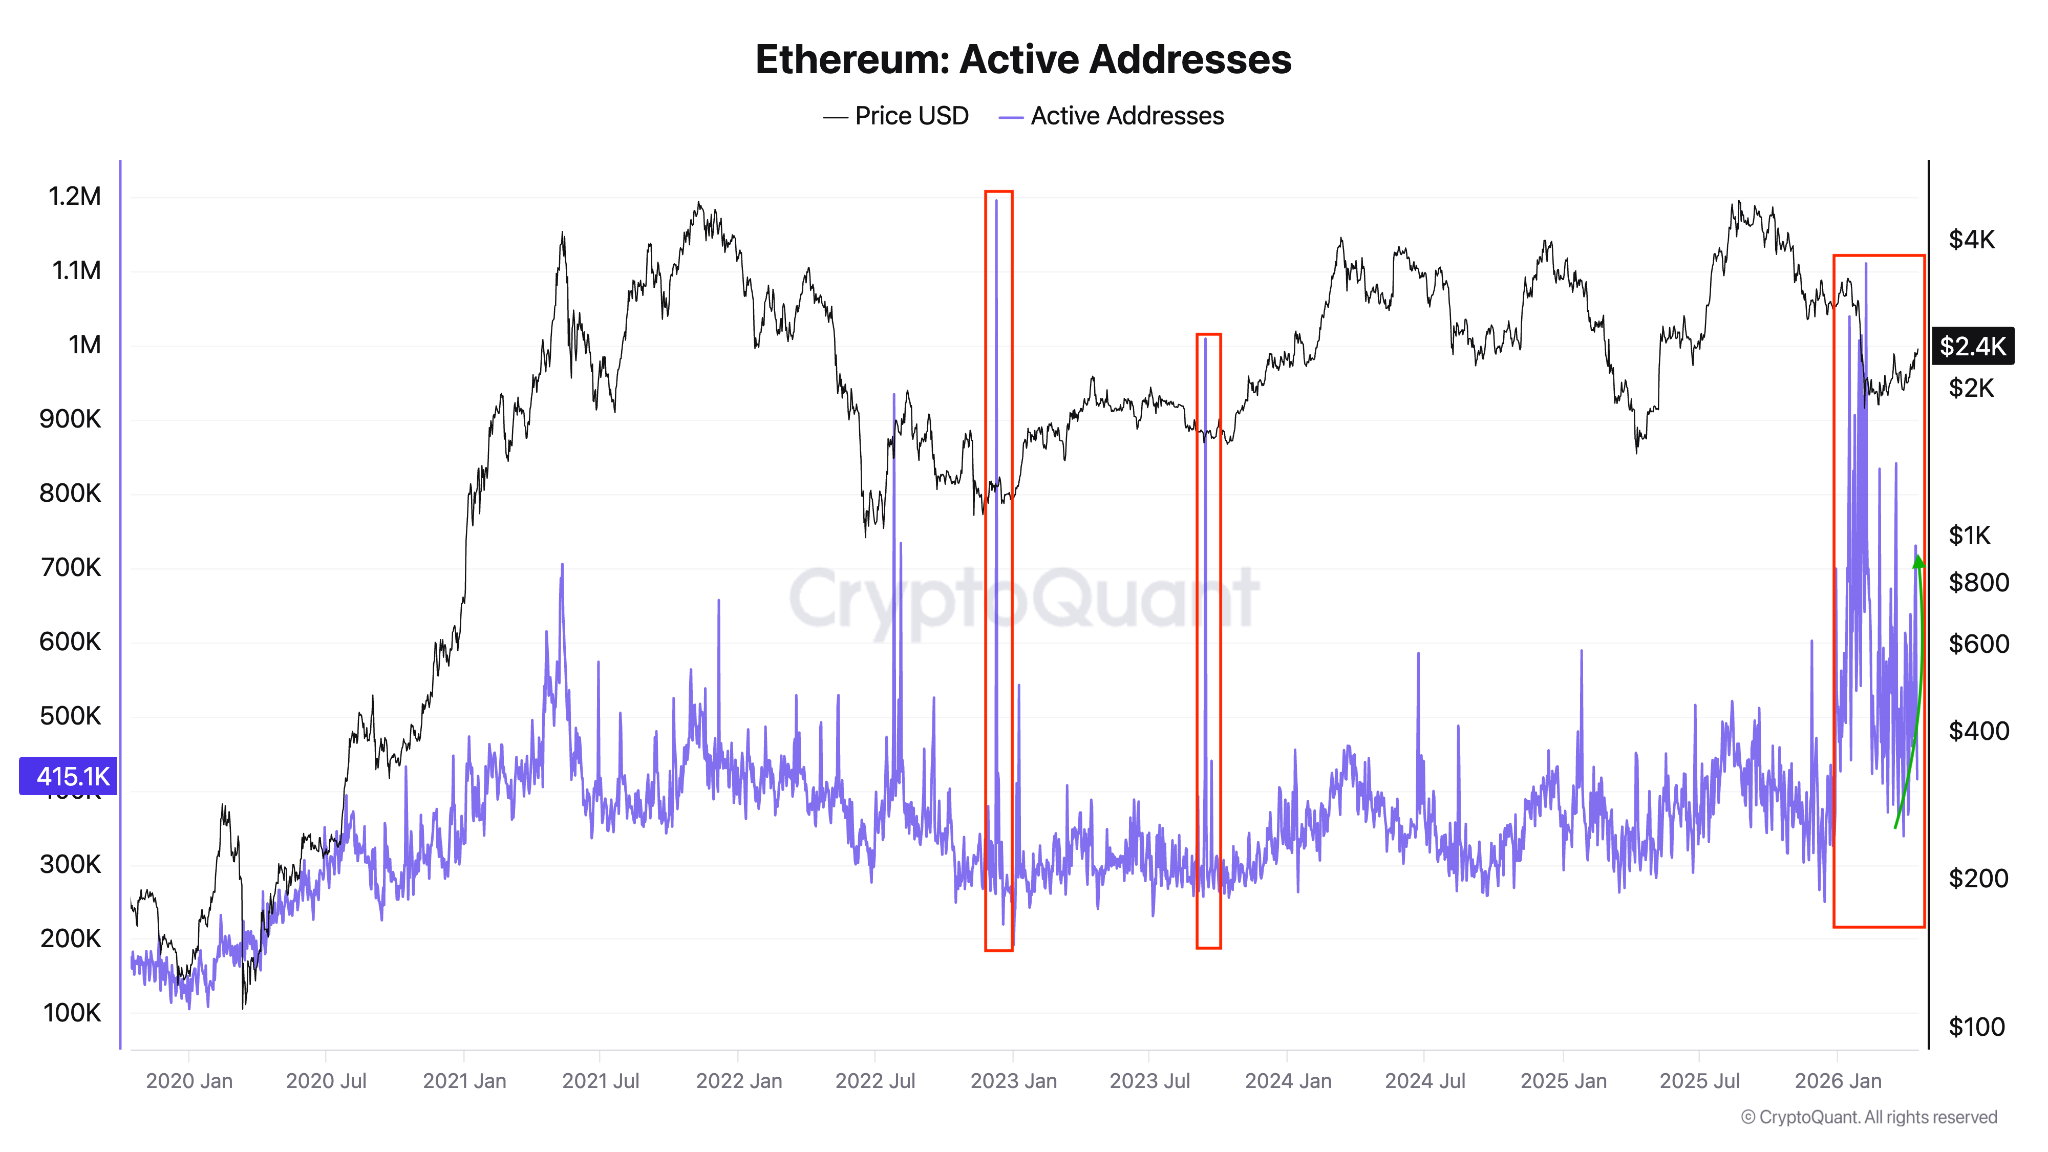
Network activity saw a dramatic surge, with daily active addresses jumping 89% from 384,763 to 730,278 on April 5. Historical patterns show similar activity spikes have coincided with market lows, including during 2022, which preceded notable price rebounds.
Accumulation addresses experienced record daily inflows of 1.14 million ETH in November 2025. Throughout 2026, these addresses have maintained an average daily inflow of 200,000 ETH, with a notable surge to 358,000 ETH recorded on Thursday.
The cumulative ETH holdings in accumulation wallets—defined as addresses with no selling history—have expanded from 19.64 million to 26.16 million ETH since the beginning of January. This represents a substantial 33% growth.
Currently, 39.2 million ETH sits locked in staking contracts. Meanwhile, exchange reserves have declined to multi-year lows, effectively tightening the available supply for trading.
Technical Formation Suggests $3,150 Price Target
From a technical perspective, ETH has completed a breakout from a cup-and-handle formation visible on the 12-hour chart. A sustained close above the $2,400 neckline establishes a projected target around $2,960. The 14-day RSI currently reads between 65–68, indicating bullish momentum.
Analyst TheSkayeth highlighted an even larger cup-and-handle structure developing over two months on the daily timeframe. The trader noted that ETH was “setting up for a massive move” and suggested that successful completion of this pattern could push prices into the “golden zone.” The calculated target from this broader formation points to $3,150.
Institutional Money Returns Through ETF Channels
Ethereum spot ETFs have maintained a seven-day streak of positive net inflows, accumulating $298.4 million in total, based on SoSoValue tracking. On April 17 specifically, these investment vehicles attracted $127 million in net inflows, as reported by Wu Blockchain.
The cryptocurrency also benefited from reduced geopolitical risk after Iran confirmed the reopening of the Strait of Hormuz following ceasefire progress involving the United States and Lebanon. ETH is currently trading above its on-chain average acquisition cost of $2,308.
The MACD indicator on ETH’s weekly timeframe has formed a golden cross—a technical signal that historically coincided with price bottoms in November 2024 and May 2025.
Open interest across Ethereum derivatives markets has risen to 14.67 million ETH. Funding rates have shifted into negative territory, indicating short sellers are establishing positions in anticipation of a potential pullback. In the last 24 hours, liquidations totaled $163.2 million in ETH contracts, with $140.9 million stemming from short positions.
Immediate support for ETH is located at the 100-day EMA around $2,378. Overhead resistance stands at $2,746, followed by a more significant barrier at $3,411.