
 Breaks Above Realized Price as Bull Flag Pattern Eyes $3,000 Rally")
Key Takeaways
- Ethereum jumped to $2,390, breaking above its $2,320 realized price level, returning the average holder to profitability
- Technical analysis reveals a bull flag formation on daily timeframes with a projected target of $3,018
- Crypto analyst Dami-Defi predicts a breakout above $2,400 could spark an aggressive rally to the $2,800–$3,000 zone
- A significant supply cluster of 7.1 million ETH exists between $2,750–$2,850, forming potential resistance
- Relative Strength Index recovered to 56 after touching near-oversold territory at 36 in late March
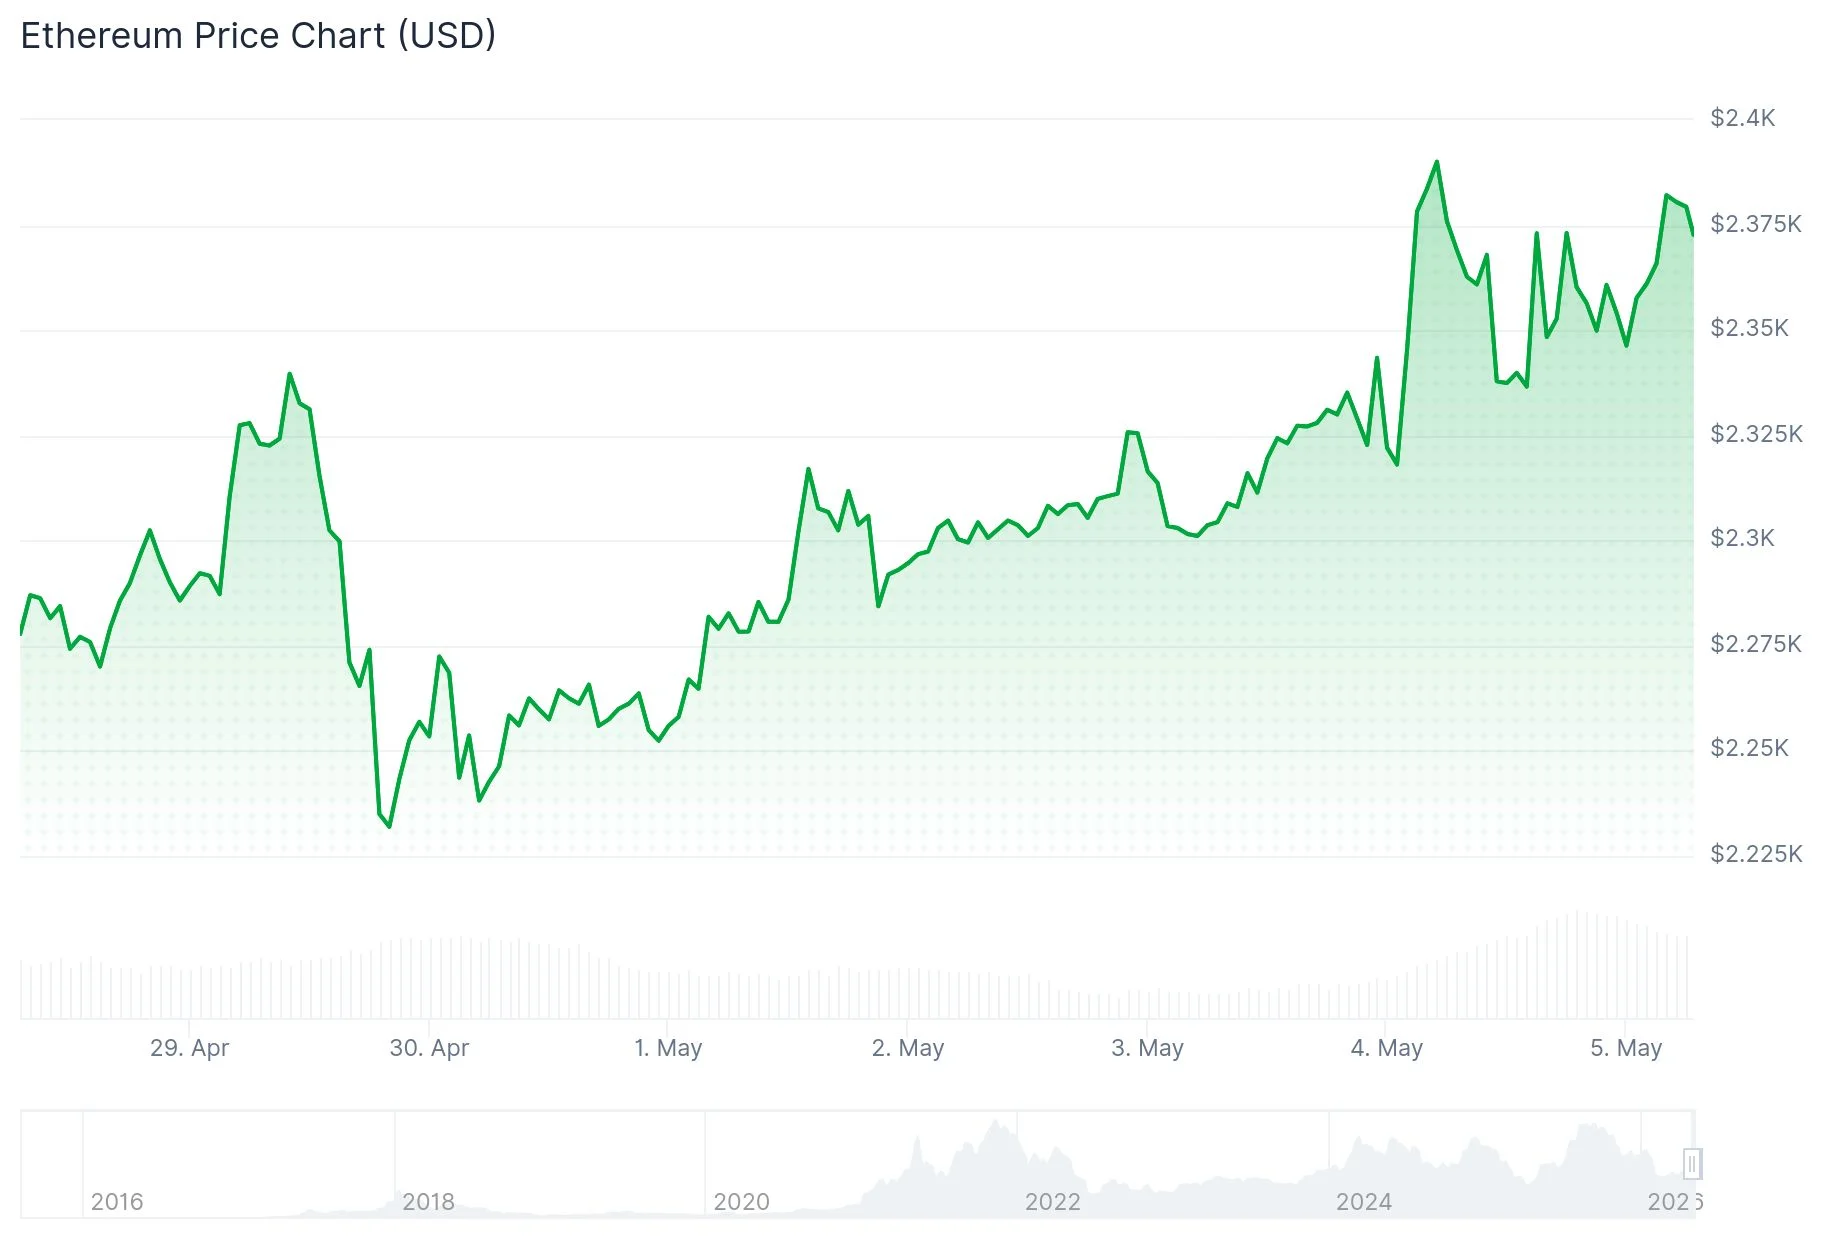
Ethereum has successfully reclaimed its realized price threshold of $2,320, a critical metric indicating that the average ETH investor has returned to positive territory. The cryptocurrency reached an intraday peak of $2,398 before experiencing a minor retracement to approximately $2,376, reflecting a 2.2% increase over the previous 24-hour period alongside $24.23 billion in trading activity.
The realized price represents the aggregate cost basis of every ETH token that has transferred on-chain throughout history. Historically, breaking above this threshold has marked a psychological transition from bearish to bullish market sentiment.
Previous instances of ETH reclaiming this metric have led to substantial rallies. Following a similar breakthrough in May 2025, Ethereum surged 173% to reach its record high of $4,950. Similarly, when this level was recaptured in early 2023, a 58% appreciation followed.
Market analyst Dami-Defi shared on X that piercing through the $2,400–$2,600 corridor would unleash the “most violent move of the year” toward the $3,000 threshold, declaring: “Once we break $2,400 we will catapult violently to $2,800–$3,000.” The analyst’s assessment highlighted a distinct momentum accumulation zone visible on weekly charts.
Technical Pattern Suggests $3,018 Price Target
Examining the daily timeframe, Ethereum has developed a textbook bull flag configuration. The asset is presently challenging the $2,350 resistance zone, where the flag’s upper trendline converges with the 100-day exponential moving average.
A confirmed daily candle close beyond this barrier would activate a measured move projection to $3,018. Market technician Cohelson David separately spotted a broadening wedge pattern on 12-hour charts that similarly indicates a potential advance toward $3,000.
The Relative Strength Index has rebounded to 56 following its descent to near-oversold readings of 36 during late March, signaling renewed accumulation pressure.
Significant Supply Barrier Near $2,800
Notwithstanding the constructive technical outlook, a substantial hurdle exists within the $2,750 to $2,850 price band. Approximately 7.1 million ETH tokens were accumulated at average cost levels within this range, establishing a zone where numerous investors may attempt to exit positions at breakeven prices.
Cryptocurrency strategist Crypto Patel identified $2,400, $2,700, and $3,000 as critical resistance thresholds warranting attention. He cautioned that unsuccessful attempts to penetrate $2,400 could trigger a pullback toward the $2,000 support area.
The MACD indicator currently shows the MACD line at 25.03 positioned beneath the signal line of 32.00, accompanied by a histogram value of -6.97, indicating some near-term momentum deterioration.
Immediate downside support is located at $2,323, with additional foundation levels established at $2,219 and $2,179. Ethereum’s total market capitalization currently registers at $282.39 billion.
ETH maintains its position above the $2,360 mark and the 100-hour simple moving average, while a constructive trend line continues to provide support at $2,350 on hourly charts.