
 Accumulation Signals Emerge Despite 50% Price Decline")
Key Takeaways
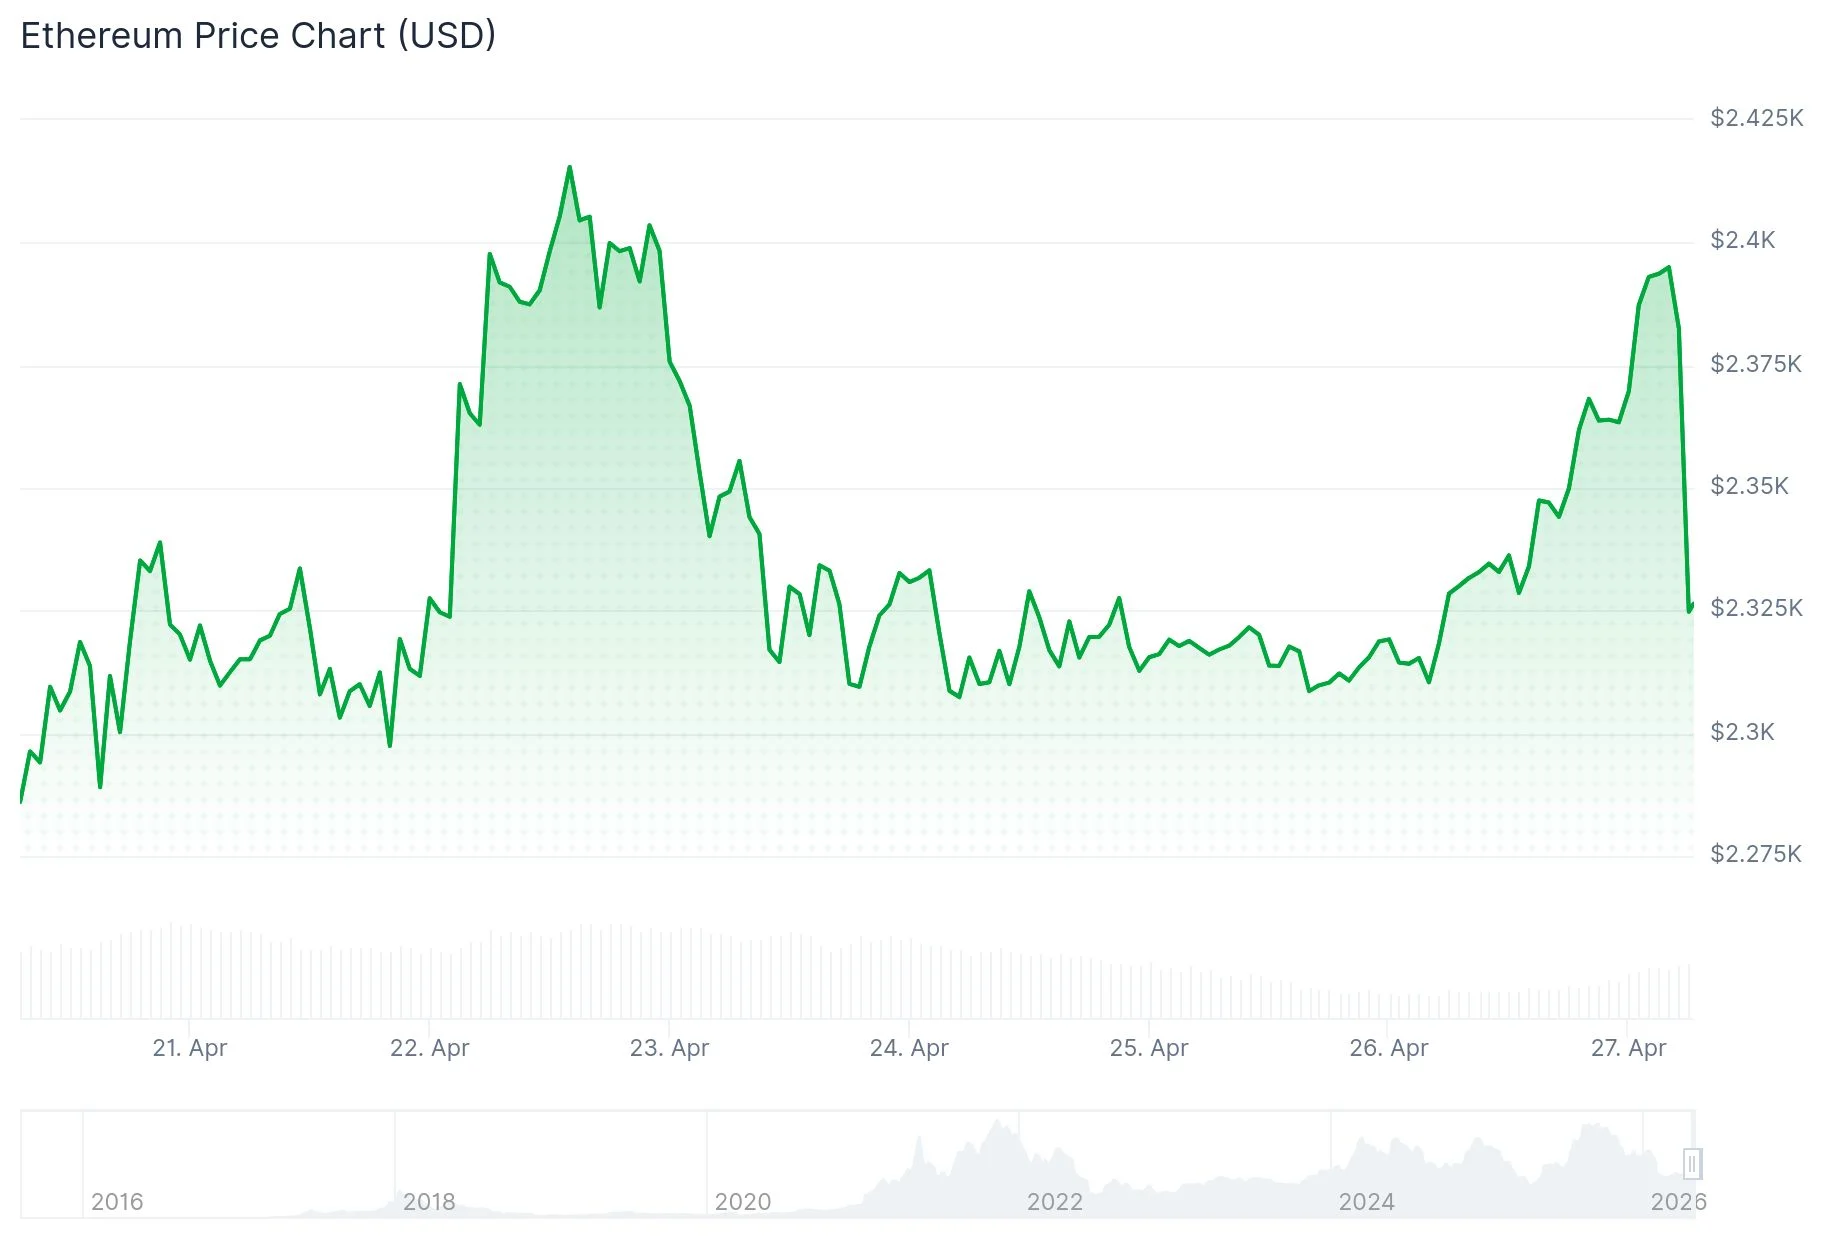
- Ethereum has declined approximately 50% from its October 2025 peak of $4,700 to current levels around $2,300, yet accumulation patterns persist
- Exchange data reveals taker buy/sell ratio reached its most elevated reading since January 2023, indicating strong demand
- Network activity surged with smart contract deployments hitting an all-time high on a 180-day moving average basis
- Spot Ethereum ETFs recorded $155 million in net inflows last week, marking the third consecutive week of positive flows
- Critical price zones: $2,400 represents overhead resistance while $2,200 provides downside support
Ethereum’s price has tumbled approximately 50% from its October 2025 peak near $4,700 to trading levels around $2,300. Yet beneath this extended downturn, blockchain analytics reveal accumulation patterns suggesting buyers are actively entering positions.
Analytics from CryptoQuant indicate the 30-day moving average of the taker buy/sell ratio has climbed to its most elevated point since January 2023. This indicator measures the intensity of market-driven buy orders relative to sell orders across major exchanges.
Market participants have been absorbing circulating supply despite continued price weakness. This accumulation pattern typically signals larger capital deploying strategies during downtrends.
Network Fundamentals Strengthen Despite Price Weakness
Additional CryptoQuant metrics demonstrate that the 180-day moving average for newly deployed smart contracts has reached unprecedented levels. Developer engagement continues expanding even while token valuation faces pressure.
Historical patterns show that elevated smart contract deployment often precedes price appreciation. The widening gap between network expansion and market valuation indicates underlying fundamentals may be undervalued relative to current prices.
Spot Ethereum ETFs attracted $155 million in net capital during the trading week spanning April 20–24, based on SoSoValue figures reported by Odaily. This represents the third successive week of positive net flows.
BlackRock’s ETHA product dominated inflows with $138 million for the period, pushing its cumulative historical net inflow to $11.97 billion. BlackRock’s ETHB contributed an additional $60.9 million. Grayscale’s ETHE experienced the largest withdrawal at $49.2 million. Combined net assets across all Ethereum spot ETF products currently total $13.79 billion.
Market commentator Ted (@TedPillows) observed that ETH remains range-bound and highlighted that disrupted US-Iran peace negotiations could introduce volatility in coming sessions. He emphasized that a successful breach above $2,400 might expose the $2,470–$2,500 liquidity cluster, whereas failure to hold $2,300 could precipitate a decline toward $2,150–$2,200.
Technical Structure and Critical Zones
On shorter timeframes, Ethereum escaped from a narrowing triangle pattern with resistance positioned at $2,320. Price climbed to an intraday high of $2,404 before entering consolidation. Current trading occurs above $2,370 and the 100-hour simple moving average.
Near-term resistance clusters at $2,400, followed by $2,420 and $2,450. A decisive move beyond $2,450 could extend gains toward $2,500 and potentially the $2,550–$2,565 region.
Regarding downside exposure, $2,330 represents initial support. Beneath that level, $2,285 and $2,200 constitute primary support zones warranting attention.
Bitmine Immersion Technologies, connected to analyst Tom Lee, disclosed plans to purchase 10,000 ETH directly from the Ethereum Foundation through an over-the-counter transaction valued at $23.9 million, which would elevate its aggregate holdings to 4.98 million ETH.