
 MVRV Golden Cross Resurfaces: Historic Rally Indicator Returns")
Key Highlights
- A potential MVRV golden cross is developing for Bitcoin, mirroring patterns that signaled previous explosive price movements.
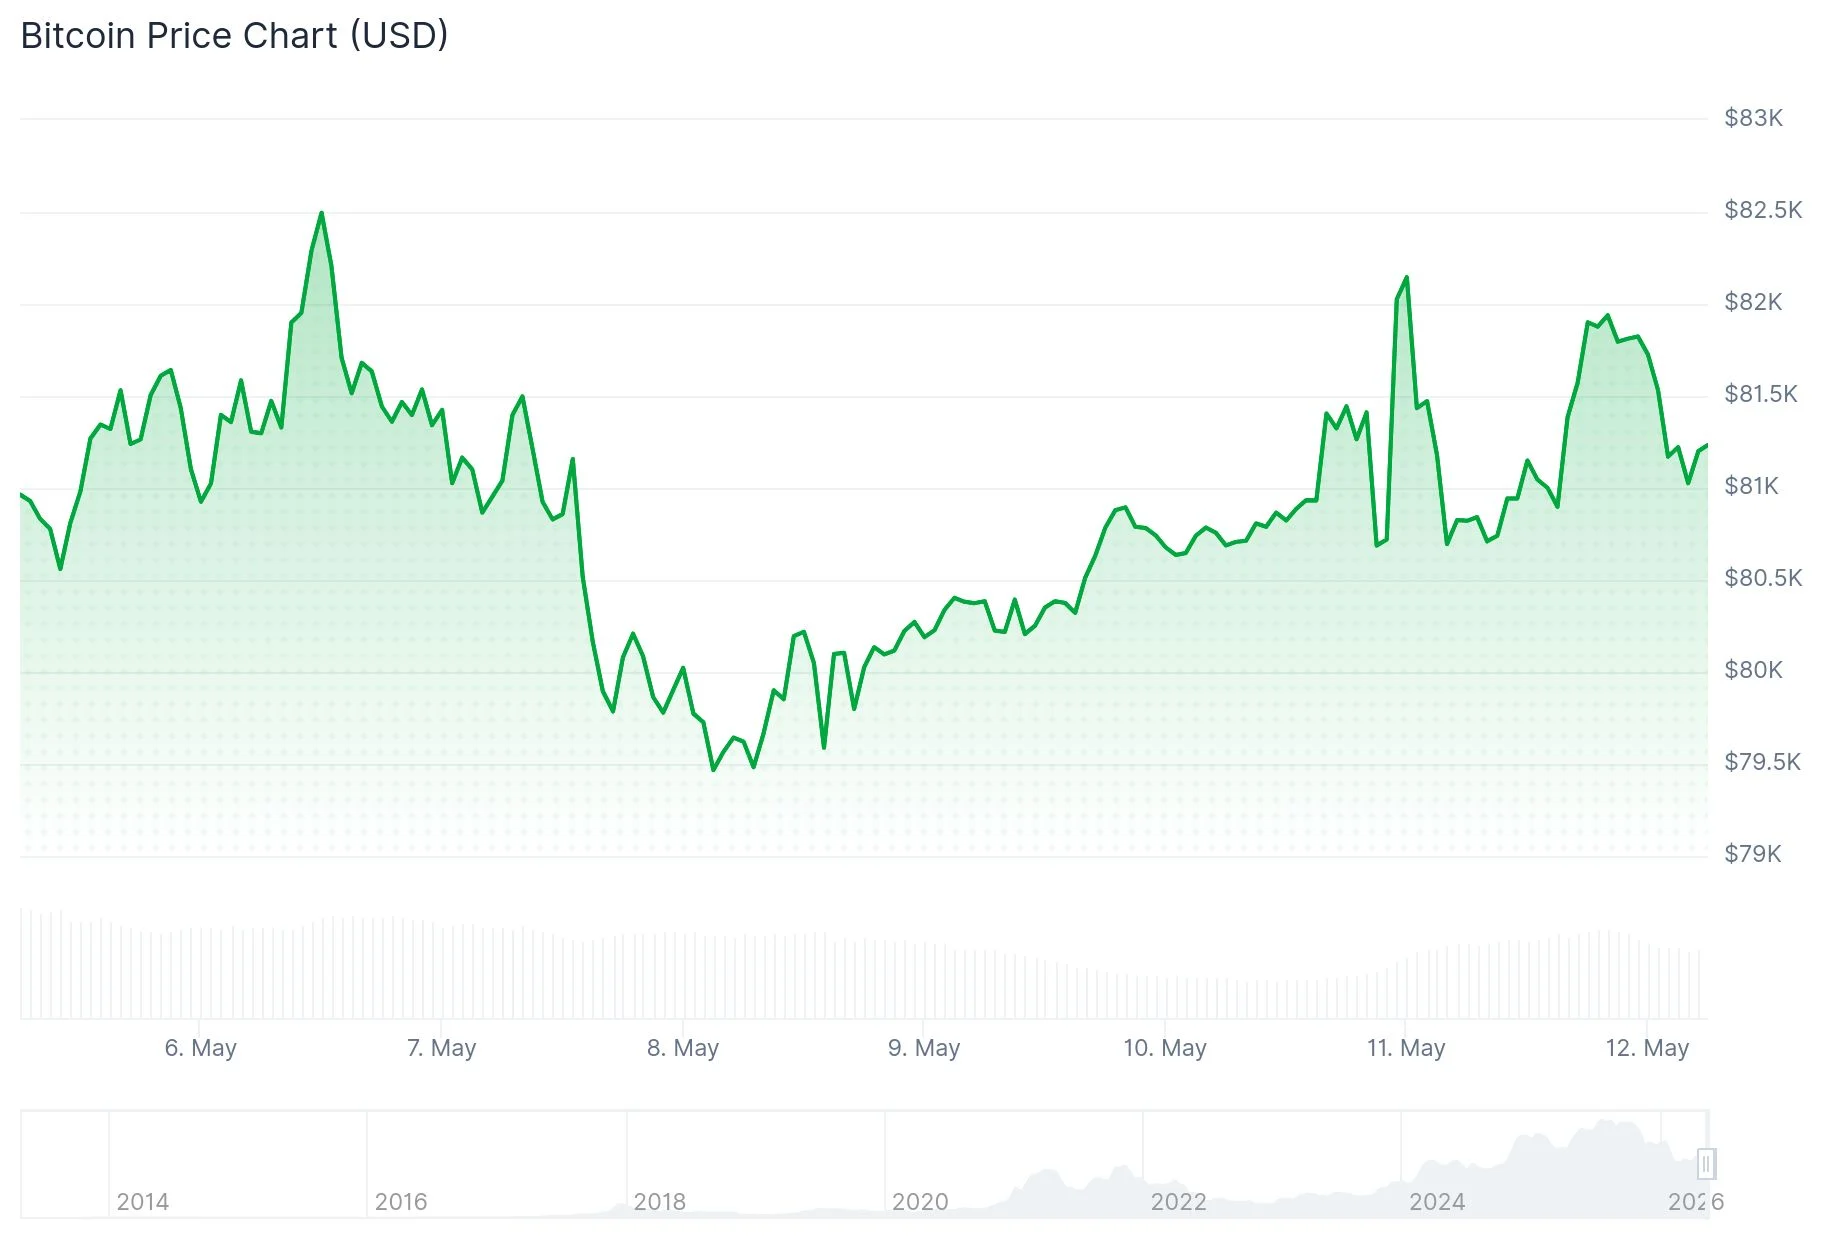
- Bitcoin continues to trade within a tight range between $80,500 and $82,000, facing critical resistance barriers.
- The short-term holder cost basis “heated” threshold stands at $92,000, while the “overheated” level reaches $104,000.
- Market analyst Daan Crypto Trades highlighted a strong weekly close above the bull market support zone, with the $82K daily 200MA representing crucial resistance.
- Spot Bitcoin ETFs pulled in $623 million in net inflows during the previous week, extending their positive flow streak to six weeks.
A historically significant technical pattern is emerging for Bitcoin as the MVRV ratio edges toward a golden cross formation, while the cryptocurrency maintains its position around the $82,000 threshold.
The MVRV (Market Value to Realized Value) metric serves as a barometer for determining whether Bitcoin trades at inflated or depressed valuations. CryptoQuant’s analyst CW8900 identified an approaching golden cross formation between the MVRV ratio and its 200-day exponential moving average. The researcher characterized this development as “a representative trend reversal signal and is a bullish indicator.”
Historical data reveals this signal has materialized on two prior occasions. Following Bitcoin’s 2022 cycle bottom, the initial crossover signaled the beginning of a 90% price surge from $16,300 to $31,000. Subsequently, a second golden cross in September 2023 foreshadowed a remarkable 400% advance that culminated in the all-time peak of $126,000 in October 2025.
CW8900 further observed that Bitcoin’s 30-day simple moving average crossed above its 90-day counterpart in late April, concluding: “BTC has completely turned to a bullish trend.”
Technical Analysis and Institutional Capital Flows
Cryptocurrency trader Daan Crypto Trades highlighted on X that Bitcoin achieved a “solid weekly close above the bull market support band,” emphasizing that a breakthrough above the daily 200MA/EMA near $82K would represent “a signal of strength for further continuation.”
Concurrently, market intelligence firm SoSoValue reported in their weekly update that Bitcoin ETF products attracted $623 million in net capital, marking the sixth consecutive week of positive flows. The firm characterized this activity as a “week of layered capital allocation” rather than an aggressive risk-on environment, observing some short-term profit realization alongside sustained institutional accumulation.
Market observer Shib Spain identified Bitcoin’s breakout above a multi-month descending trendline on weekly timeframes, referencing a MACD bullish crossover as technical confirmation. Meanwhile, analyst Moustache pointed to the Bitcoin market cap RSI rebounding from multi-year monthly support levels, declaring: “Prices will go much, much higher.”
Current Price Structure and Critical Thresholds
Bitcoin experienced rejection above $81,500 and retreated lower, currently maintaining ground above $80,500 alongside the 100-hour simple moving average. Technical charts reveal a contracting triangle formation on hourly timeframes, with pattern support established at $80,800.
Should BTC overcome resistance at $81,800 and $82,000, subsequent barriers emerge at $82,250, $82,500, and $83,500. Conversely, if downward pressure intensifies, primary support zones exist at $80,400, followed by $79,400, and $78,500.
The short-term holder cost basis “heated” threshold remains positioned at $92,000, with the “overheated” zone calculated at $104,000. While some profit-taking activity has occurred, blockchain analytics from Glassnode indicate Bitcoin retains upward momentum potential in the near term.
The $623 million in BTC ETF inflows throughout the past week represents the sixth straight week of positive institutional allocation, with long-term positioning capital remaining committed despite brief two-day outflows observed toward the week’s conclusion.