
 Breaks Through $73K Barrier as ETFs Draw $1.47B and Legendary Trader Changes Stance")
TLDR
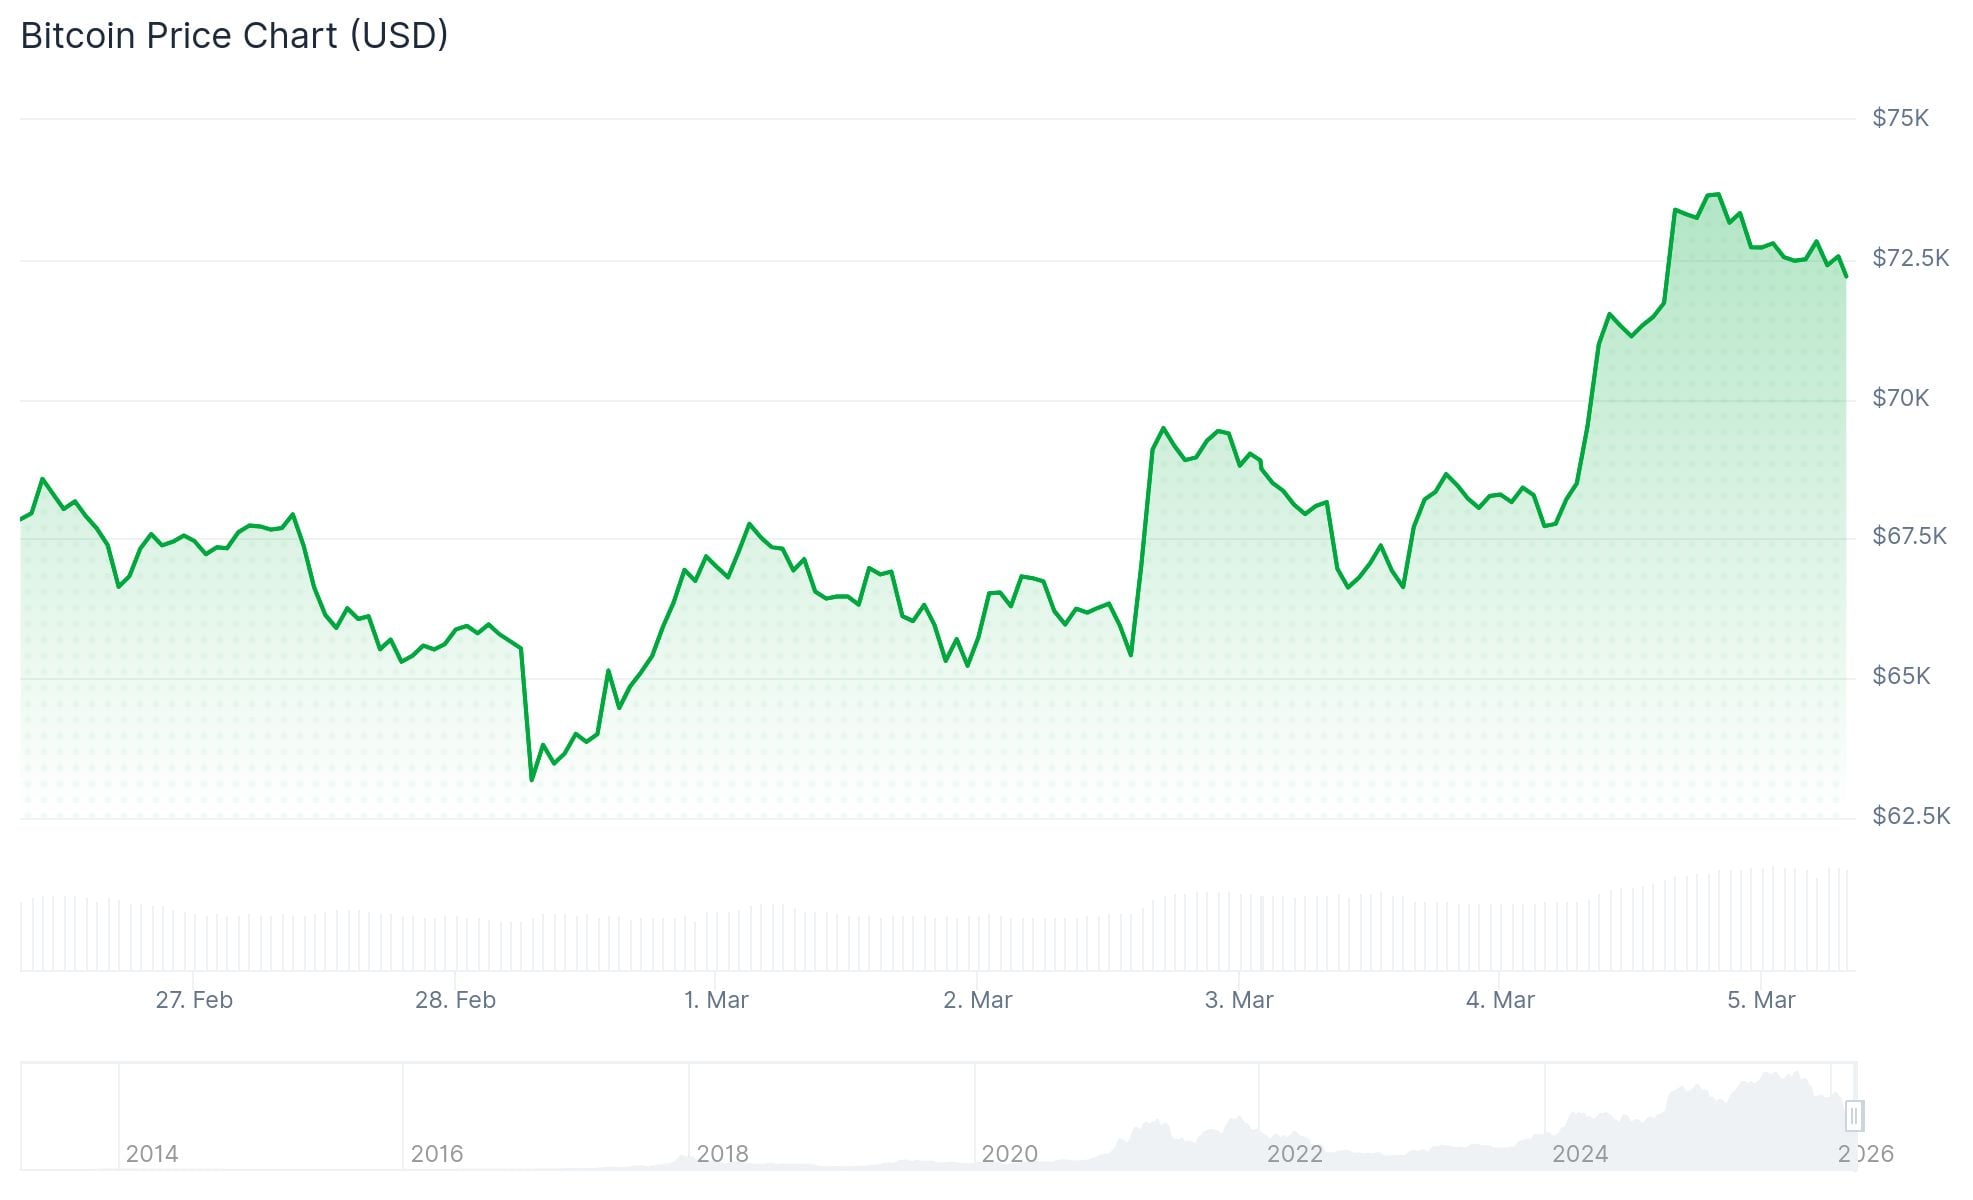
- BTC broke through the $73,000 threshold, hovering between $72,500 and $73,187 during Thursday’s session
- Spot Bitcoin ETFs in the United States attracted $155 million on Wednesday alone, part of a $1.47 billion two-week influx
- Legendary chartist Peter Brandt indicated the current price movement might represent a reversal from the October high
- BTC has outshined gold following Iranian military actions, climbing more than 10% versus gold’s nearly 2% decline
- Glassnode’s blockchain metrics suggest caution: approximately 57% of circulating BTC remains profitable
Bitcoin has successfully reclaimed territory above $70,000 throughout this week, touching a peak of $73,544 during Asian market hours before moderating to approximately $72,500 by Thursday morning in London.
This upward momentum reflects a broader risk asset recovery following turbulence triggered by military operations conducted by the United States and Israel against Iran during the previous weekend.
The cryptocurrency gained 8% throughout Wednesday’s U.S. trading session before retreating 1.8% on Thursday. South Korea’s Kospi index soared 11% while Japan’s Nikkei climbed 4.2% during the same timeframe, suggesting a widespread market rally.
Bitcoin’s Coinbase premium indicator — which had turned negative on Sunday — has now flipped positive. Market analyst Ted Pillows observed it hitting its strongest reading since October 2025, indicating robust demand from American investors.
“Market sentiment is shifting bullish once more across the cryptocurrency sector,” stated Caroline Mauron, co-founder at Orbit Markets.
From the day preceding the Iranian strikes, Bitcoin has appreciated over 10%. Meanwhile, gold declined nearly 2% across the identical timeframe. This represents a complete reversal from recent months’ patterns, during which gold consistently achieved all-time highs while Bitcoin declined.
Bitcoin ETF Capital Continues Fourteen-Day Run
Spot Bitcoin ETFs in the United States recorded approximately $155 million in net positive flows on Wednesday. This continues a fourteen-day pattern totaling roughly $1.47 billion in fresh investment, based on SoSoValue tracking data.
March alone has witnessed over $1.1 billion flowing into American Bitcoin ETFs, including a single-day record of $462 million, according to Bloomberg intelligence.
Bitfinex researchers have cautioned that ETF inflows don’t necessarily translate immediately into spot market purchases, since authorized participants can establish ETF shares before actually acquiring the underlying Bitcoin.
Legendary Trader Peter Brandt Adjusts Outlook
Renowned trader Peter Brandt, who had held a bearish position since the October peak around $127,500, shared on X this week that current market structure might represent “the significant change of price behavior since the top in Oct.”
Bitmine’s chairman Tom Lee responded to Brandt’s commentary, characterizing it as a “potential inflection/change Bitcoin” juncture.
Market commentator Milk Road highlighted $225.2 million in ETF inflows on a single day and $458.2 million the preceding day — totaling nearly $700 million across 48 hours — suggesting this could materially impact supply-demand equilibrium.
Key resistance zones exist between $75,000 and $78,000. Critical support levels are positioned at $65,000 and $60,000.
Notwithstanding the recent rally, Glassnode data reveals that roughly 57% of Bitcoin supply currently sits above water — a metric historically associated with early bear market phases. The average acquisition cost of short-term holders hovering near $70,000 may function as a cap, potentially converting rallies into selling opportunities.
U.S. Treasury Secretary Scott Bessent announced a 15% worldwide tariff rate will probably commence this week, which may exert downward pressure on financial markets.