
 Struggles at Critical $0.243 Level as April Begins")
Key Takeaways
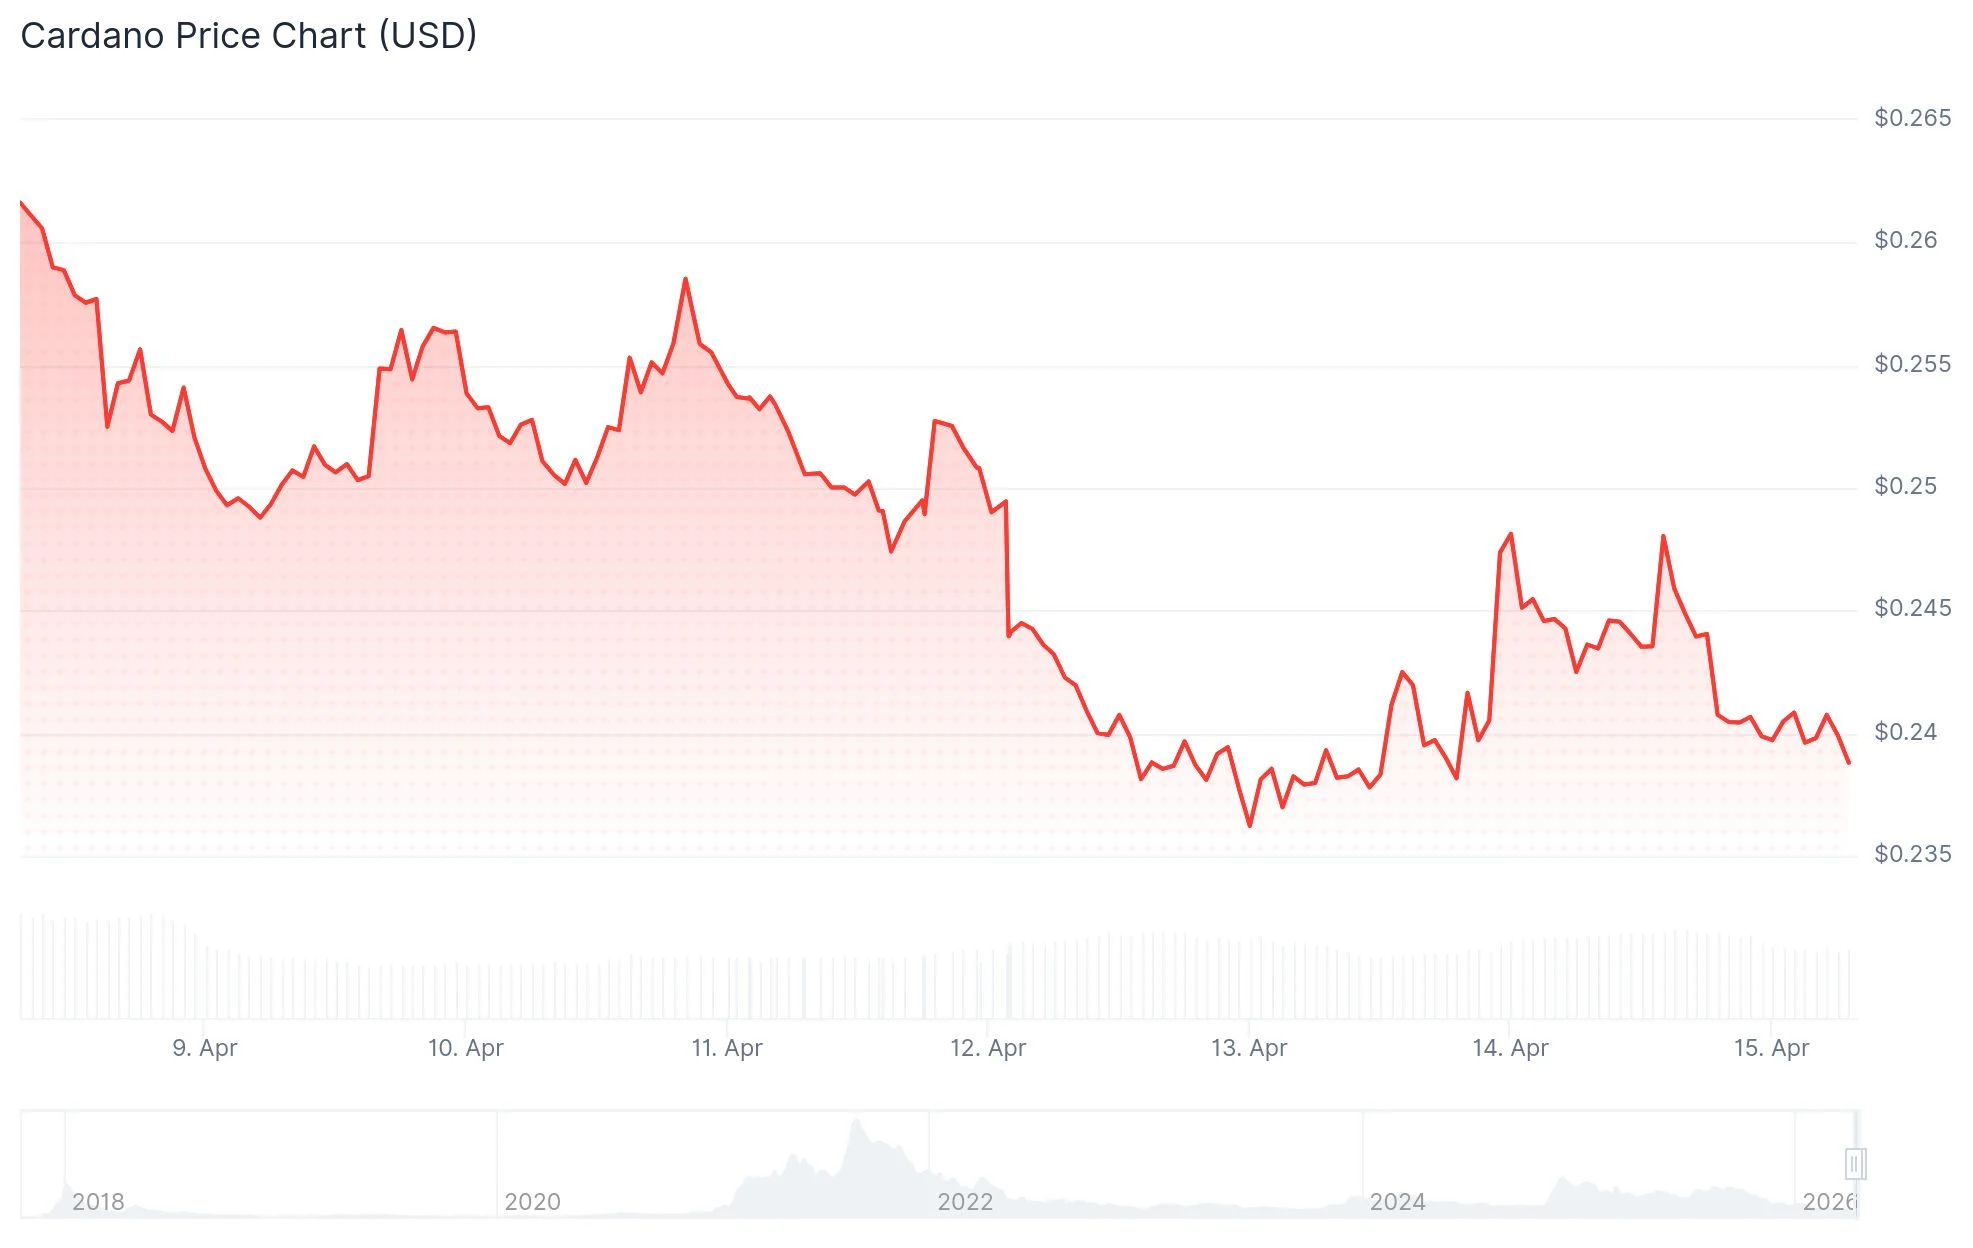
- Cardano currently hovering between $0.239 and $0.243, experiencing a Wednesday decline of approximately 4%
- On-chain metrics indicate selling activity from long-term token holders through dormant wallet movements
- Price action remains beneath all major exponential moving averages with bearish momentum signals
- Seven-day performance shows ADA flat while BTC gained 8.7% and ETH climbed 13.2%
- Critical support level established at $0.220; failure to maintain $0.243 could trigger decline toward $0.10
Cardano (ADA) is currently positioned between $0.239 and $0.243 during Wednesday’s trading session, registering a nearly 4% decline following rejection from a crucial resistance zone on Tuesday. The altcoin continues to trail significantly behind major cryptocurrencies, with Bitcoin posting 8.7% gains and Ethereum climbing 13.2% over the past week, while ADA has essentially moved sideways during the same timeframe.
Blockchain analytics from Santiment reveal a concerning negative surge in Cardano’s Network Realized Profit/Loss (NPL) metric on Tuesday. This development indicates that token holders were predominantly liquidating positions at a loss. Simultaneously, the Age Consumed metric experienced an upward spike, demonstrating that previously dormant tokens—assets that have remained stationary in wallets for extended periods—are being mobilized.

A comparable on-chain pattern emerged in early December, which preceded a substantial price correction. Market observers are monitoring whether current conditions will produce a similar outcome.
Bearish Technical Structure Dominates
Cardano’s price action continues to struggle below all significant Exponential Moving Averages, including the 50-day, 100-day, and 200-day periods. The 50-day EMA is currently positioned at $0.262, while the Relative Strength Index on the daily timeframe reads approximately 43. The MACD indicator displays a slightly negative reading, confirming limited bullish momentum.
Immediate resistance stands at $0.245. A sustained daily close above this threshold would represent the first constructive signal, potentially unlocking pathways toward $0.262 and subsequently $0.271. On the support side, the primary floor sits at $0.220, representing the recent cyclical bottom.
CoinGlass metrics indicate the long-to-short ratio reached 0.95 on Wednesday. Ratios below 1.0 signify that a majority of traders maintain short positions, anticipating further price declines. This bearish positioning has persisted throughout most of March.
Market analyst Ali Charts highlighted on social platforms that ADA has revisited a critical “make-or-break” threshold at $0.243. He characterized this zone as a historically significant pivot point, warning that failure by bulls to defend this level on a daily closing basis could trigger a deeper retracement toward yearly lows around $0.10. Conversely, successful defense of this support could catalyze a recovery rally toward $0.30.
Derivatives and Exchange Flow Data Signal Distribution
Cardano has been unable to maintain a daily close above its 50-day Simple Moving Average since early October 2025. Following the breakdown below this level, the cryptocurrency has plummeted approximately 70% from its $0.819 peak.
Derivatives market data from CoinGlass reveals $207.5 million in capital entering derivative positions over the past 24 hours, while $211.1 million exited these contracts. Open interest has also experienced a modest decline. Exchange spot flows registered $34.53 million in inflows compared to $32.78 million in outflows, suggesting some holders are transferring tokens to trading platforms—typically interpreted as a precursor to selling activity.
As of Wednesday’s trading session, ADA was last quoted at $0.239.