
 Eyes $90 Breakout While Long-Term $1,000 Target Remains Alive")
Key Highlights
- SOL maintains support around $80 with key resistance positioned near $87
- Technical analysis identifies $88–$90 zone as next Fibonacci-based target
- Weekly timeframe analysis preserves $1,000 long-term bullish scenario
- Solana ETFs experienced outflows exceeding $17 million during the past week
- Derivatives open interest dropped to $4.72 billion, indicating diminished market participation
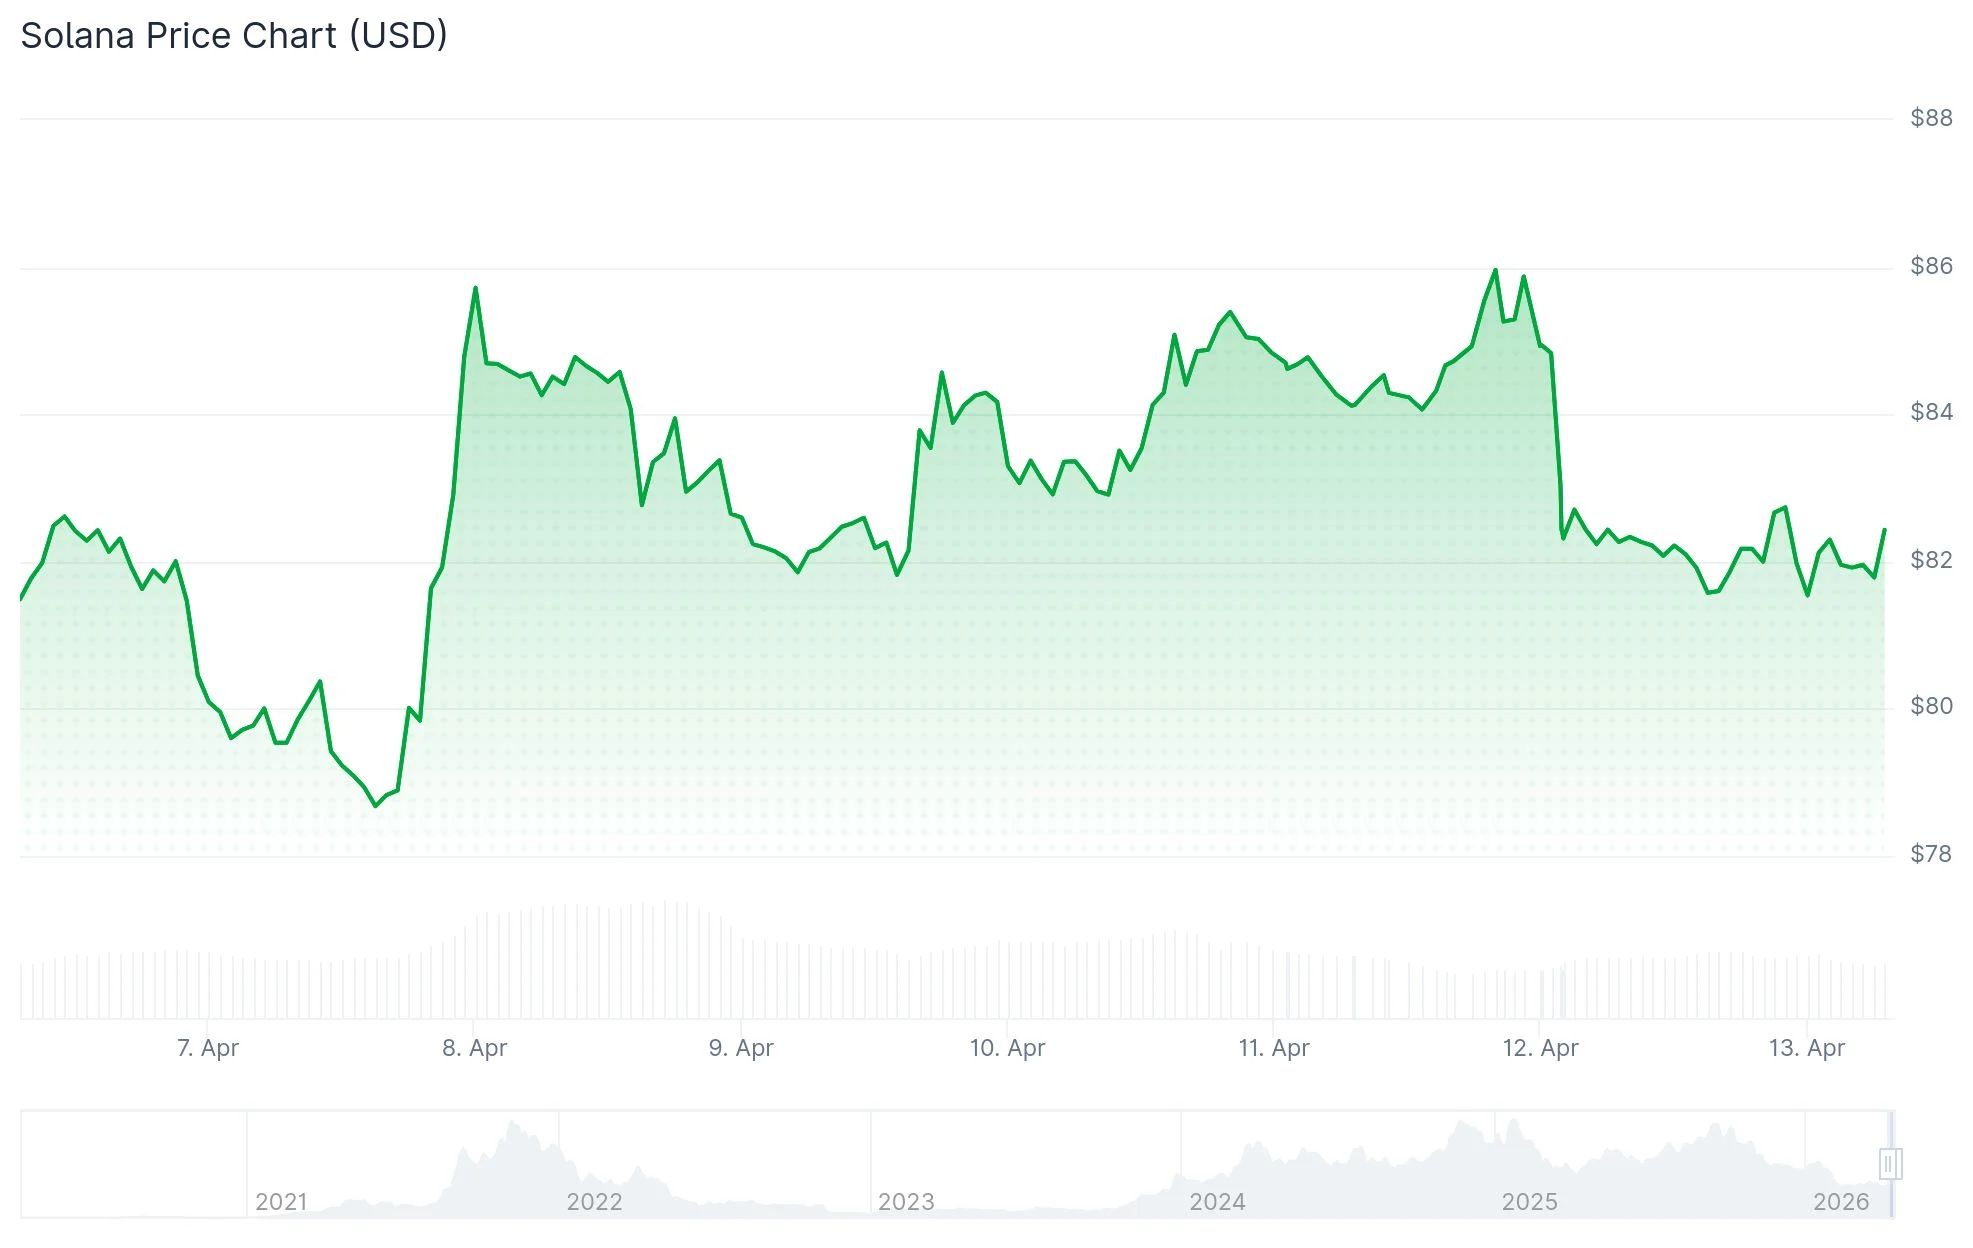
Solana currently hovers around the $80 level as the week begins, after experiencing a 4% decline on Sunday. This downward movement occurred in tandem with a widespread cryptocurrency market correction. Recent price behavior has been confined to a range, with bullish forces finding it difficult to breach a critical overhead barrier.
The 50-day exponential moving average currently rests at $87.43, positioned directly beneath a falling trendline. This confluence has consistently rejected bullish attempts. The 100-day EMA stands at $99.19 while the 200-day EMA is located at $118.32, both representing significant overhead resistance levels.
According to short-term technical analysis from MCO Global, a progressive recovery pathway targets a Fibonacci-derived zone spanning $88.13 to $90.01. Multiple wave projection models converge on this identical range, establishing it as the next logical target should the rebound maintain its trajectory.
Critical support lies between $71.92 and $77.92. The February 5 low of $77.60 serves as the most immediate support level. A breach beneath this threshold could potentially trigger a move toward $67.50.
Institutional Outflows Weigh on Sentiment
Solana-based exchange-traded funds documented outflows surpassing $17 million throughout the week. A substantial redemption earlier in the period accounted for the majority of this movement. Friday saw $11.45 million in fresh inflows, which reduced the week’s net outflow to $5.62 million.

This represents the third consecutive week of negative net flows from Solana ETFs. The trend suggests waning institutional demand for SOL exposure at present price levels.
Derivatives open interest contracted to $4.72 billion on Monday, declining from the previous day’s $4.88 billion. Funding rates continue to register marginally positive, indicating long positions maintain a modest advantage over short positions.
The Relative Strength Index remains positioned below 50, signaling subdued buying pressure. The MACD indicator trades beneath the zero line while displaying preliminary indications of weakening bearish momentum. However, no definitive bullish reversal pattern has materialized.
Extended Timeline Preserves Four-Figure Bull Scenario
Technical analyst James Easton examines the weekly timeframe and contends the overarching structure has not been invalidated. From his perspective, Solana continues trading within a broad ascending channel and hasn’t broken down from the macro pattern.
He identifies an ambitious long-term bullish objective at $1,000, contingent on SOL avoiding a severe breakdown and ultimately reclaiming upward momentum. Within this framework, the present weakness appears more characteristic of consolidation rather than structural failure.
The weekly MACD remains subdued, with momentum yet to demonstrate upward inflection. This indicates the extended-term bullish thesis survives but requires considerable patience.
Solana’s latest trading data confirms price support just above $80, with market participants closely monitoring the $87–$90 resistance zone for the next directional move.