
 Rallies Above $2,000 as Bullish Momentum Builds")
Key Highlights
- ETH maintained its position above the $2,000 threshold with derivatives indicators revealing intensified buying activity.
- Positive net taker volume has persisted since early March, indicating heightened buyer participation.
- Open interest in futures contracts climbed to 6.4 million ETH, nearing previous yearly highs.
- Spot Ethereum ETFs attracted $120 million in net capital, marking the strongest single-day performance since mid-March.
- Market observers emphasize the importance of maintaining $2,000, with additional support identified between $1,750 and $1,800.
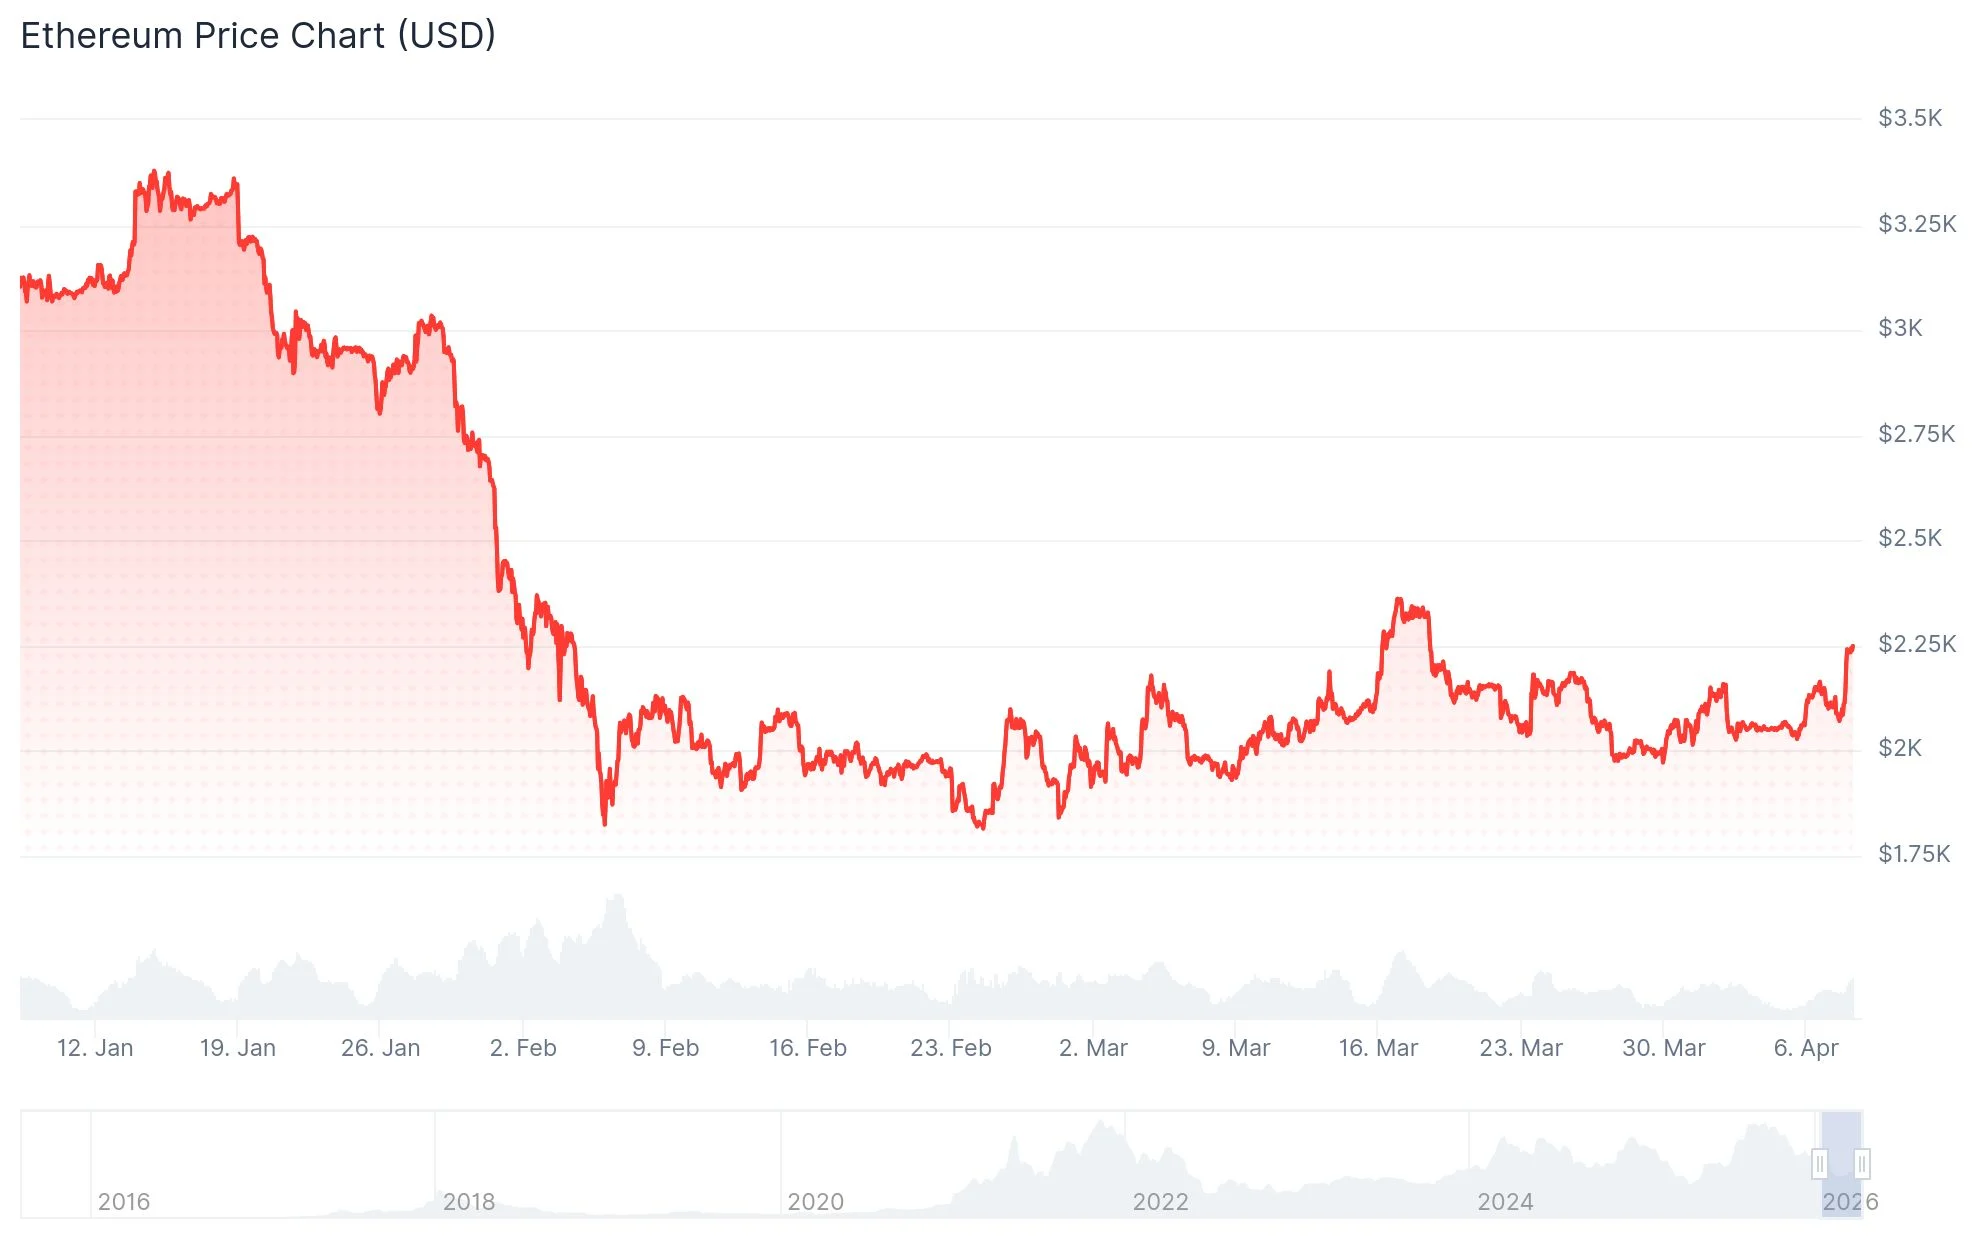
Ethereum (ETH) was changing hands near $2,249 following a decisive rally that saw buyers successfully protect the critical $2,000 support zone. Emerging market indicators point toward a revival in underlying demand.
Market analysts examining derivatives markets report that purchasing activity has taken the lead, sparking speculation about a potential trend reversal.
The net taker volume metric has registered positive readings continuously since March 6, serving as an indicator of whether aggressive purchasers or sellers dominate derivatives exchanges.
According to analyst Darkfost, buying momentum remained dominant with net taker volume reaching $104 million. He noted this represented the first sustained shift of this magnitude in Ethereum derivatives markets since the previous bear cycle.
ETF Capital and Futures Activity Signal Strengthening Interest
The analyst suggested this configuration could reinforce an upward trajectory if sustained alongside strengthening spot market participation. Rising futures engagement provided additional confirmation.
Open interest in Ethereum futures expanded to 6.4 million ETH, approaching the record level of 7.8 million ETH established in July 2025.
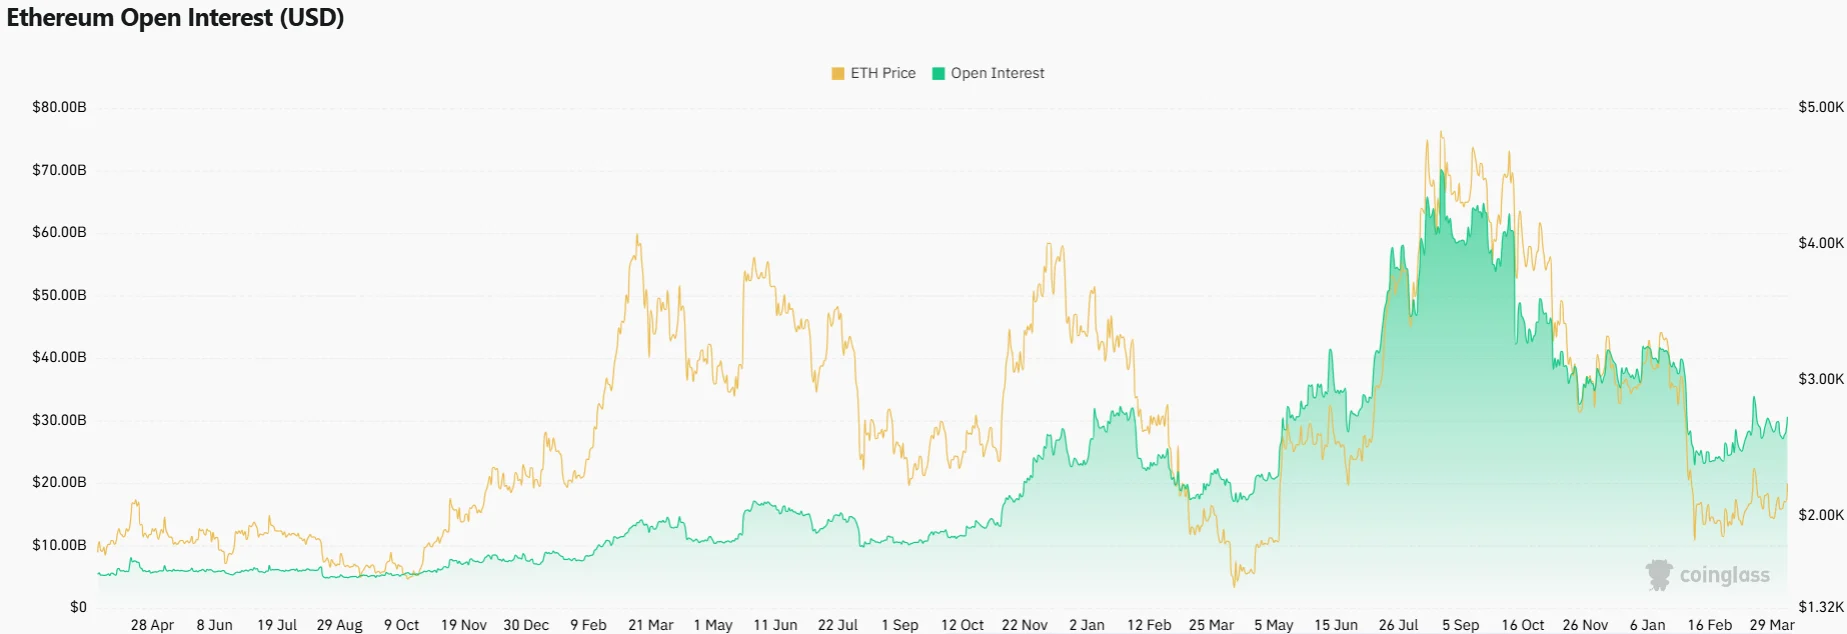
Following a decline to 5 million ETH in October, open interest has staged a notable recovery, demonstrating continued vitality in derivatives trading.
Spot Ethereum ETFs exhibited a reversal in investor sentiment, accumulating $120 million in net capital inflows on Monday—the largest single-day figure since the middle of March.
This influx followed a brief withdrawal phase, indicating renewed purchasing activity from institutional investors in the United States.
The cryptocurrency briefly advanced beyond $2,250 before encountering resistance. Hourly chart analysis revealed a breakout above descending triangle resistance around $2,150, though prices subsequently consolidated.
The Significance of the $2,000 Support Zone
Technical analysts maintain that Ethereum’s chart structure remains favorable provided the $1,800 to $2,000 support range stays intact. This zone corresponds with the 20-day exponential moving average and the bottom boundary of a symmetrical triangle formation.
Analyst Ted Pillows suggested Ethereum could attempt another upward push if $2,000 support persists, while warning that a breach could trigger a decline toward fresh yearly lows.
On-chain cost basis analysis reinforces the importance of the $2,000 region, where approximately 3.5 million ETH tokens were accumulated at similar price levels.
A secondary demand cluster exists between $1,750 and $1,800, representing 1.36 million ETH in accumulated positions. A breakdown below this range could activate a triangle pattern target near $1,460.
Ali Charts highlighted that Ethereum’s 0.80 MVRV metric currently rests around $1,880, a threshold that has historically marked capitulation points where weaker hands exit and long-term holders accumulate.
For near-term price action, critical support levels include $2,220, $2,165, and $2,120. Overhead resistance is positioned at $2,250 and $2,275, with recent trading activity stabilizing above the $2,200 mark.