
 Revisits Critical Support Zone That Fueled Previous 2,200% Surge")
TLDR
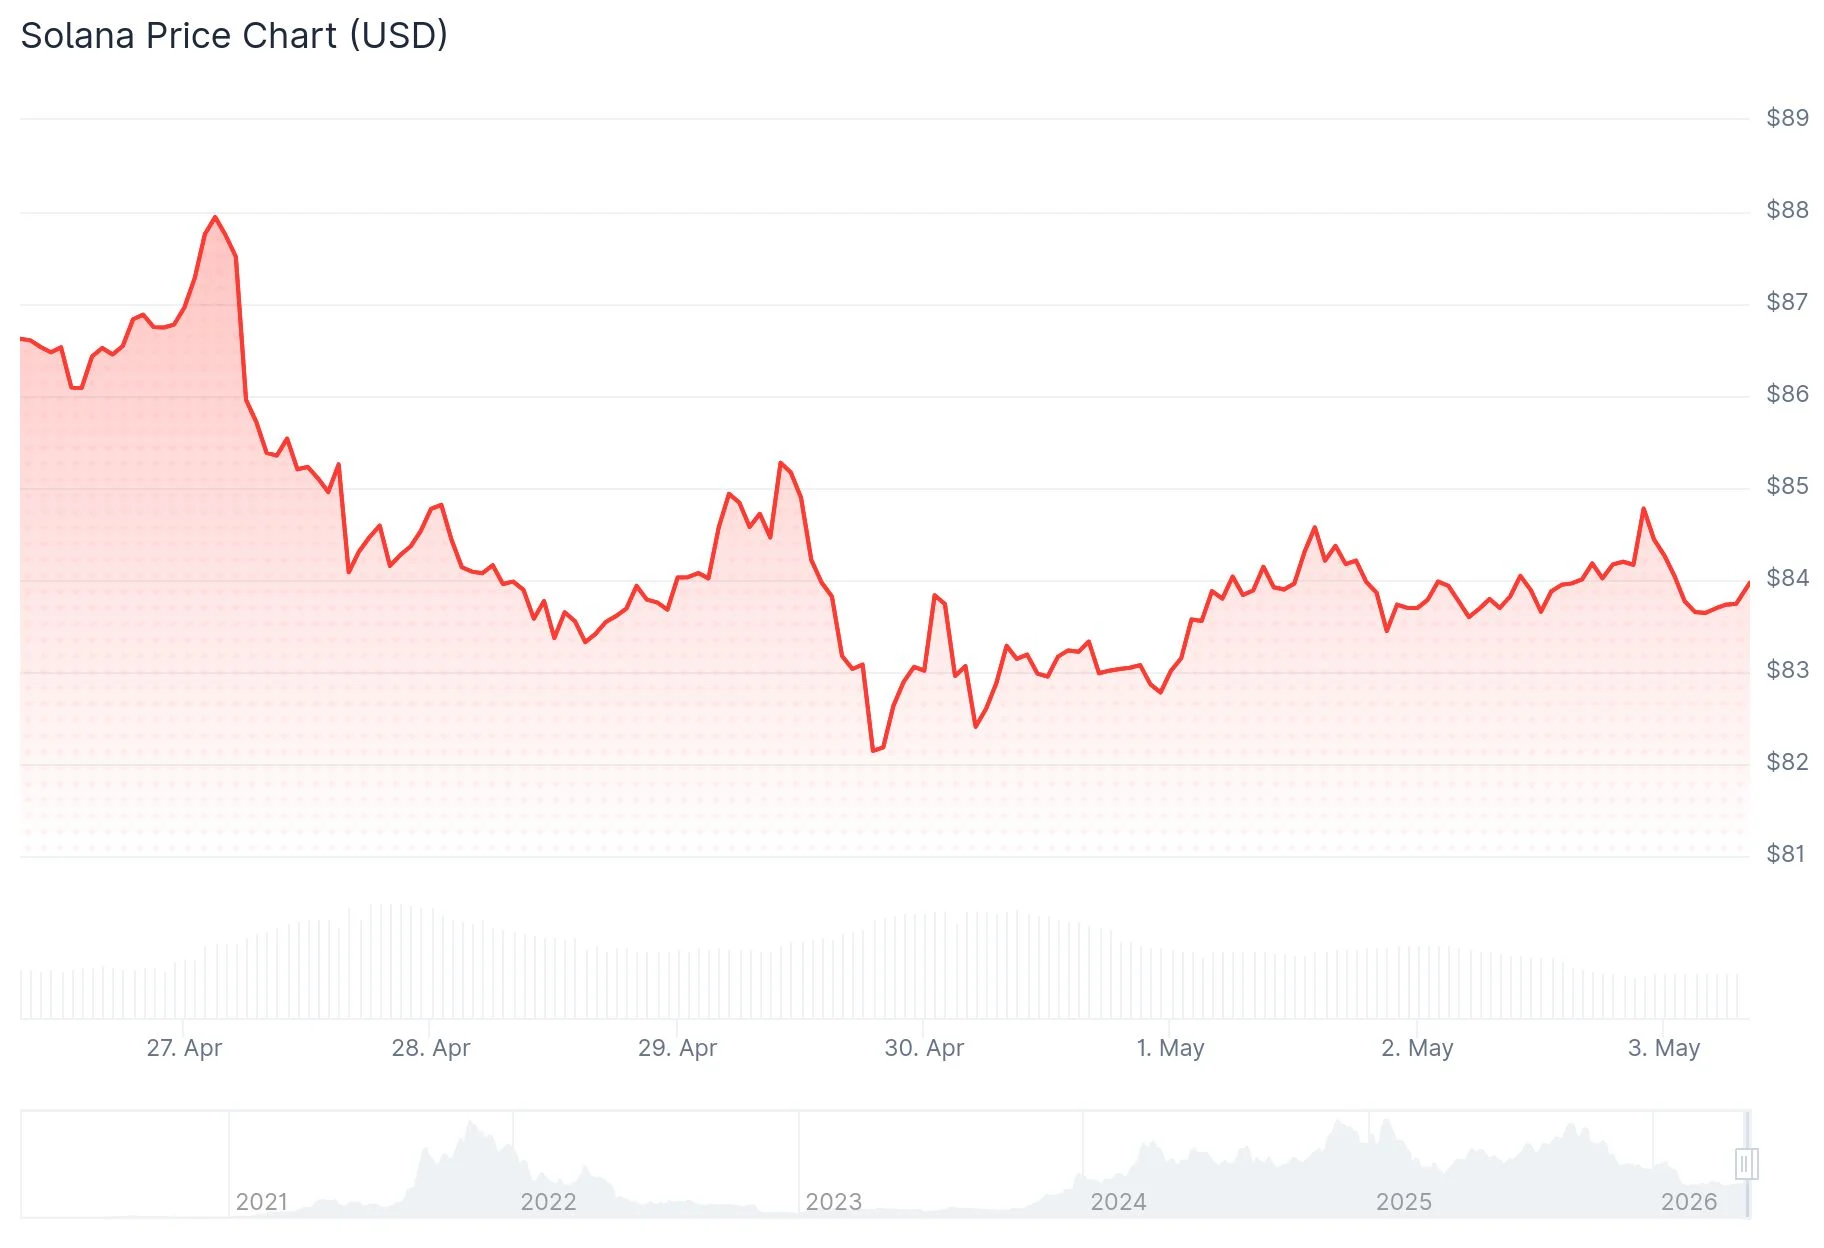
- SOL hovers around $80–$85, a historically significant zone that catalyzed major price surges in previous cycles.
- Liquidation data reveals concentrated short positions between $84 and $87.
- Bulls must reclaim $106.24 to confirm renewed upward momentum.
- Crypto analyst Patel highlights SOL’s return to the same support area that preceded a 2,200% increase previously.
- A converging triangle formation suggests potential breakout targets between $250–$300 if current support holds.
Solana is currently exchanging hands in the $80 to $85 range, a price territory that has historically marked significant turning points across multiple market cycles. The asset has declined over 70% from its 2025 peak, bringing it back to this familiar support area.
This price region has proven pivotal before. During 2021, SOL surged from single-digit levels to exceed $250. Following a sharp downturn in 2022 that brought prices near $10, the asset recovered and eventually climbed to approximately $290 in the subsequent cycle.
Prominent market analyst Crypto Patel highlighted this historical parallel in a recent observation. In his post on X, Patel stated: “$SOL is back at the same buy zone that pumped it 2,200% last cycle. Will it hit $1000 in alt season?” His commentary underscores a recurring pattern where this specific price territory has historically served as a foundation for substantial upward movements.
Critical Price Thresholds Under Scrutiny
Liquidation mapping data from CoinAnk reveals a concentration of short positions clustered between $84 and $87. After briefly touching approximately $81, the price has rebounded toward this upper liquidation zone. These heatmaps identify price levels where leveraged traders face potential forced liquidations.
Chart analysis from analyst Don identifies $106.24 as the crucial resistance level that SOL must breach to validate a bullish reversal. Without clearing this threshold, the technical outlook remains unconvincing for a sustained uptrend. Beyond $106, the next significant target appears at $260.17, though this remains considerably distant from current trading levels. Should buyers lose control of the present support area, technical indicators suggest a potential retest of $80 or deeper levels.
Converging Triangle Formation Builds Tension
Market analyst Javon Marks presented technical analysis revealing SOL confined within an extensive triangle consolidation pattern. This formation displays progressively lower peaks and ascending troughs over an extended timeframe, a configuration that typically precedes significant directional movement.
Solana currently trades near the triangle’s lower boundary, positioned within the $75 to $85 range. Should buyers successfully defend this support zone, technical projections indicate potential breakout objectives in the $250 to $300 territory. Conversely, a decisive breakdown below the mid-$60s would invalidate the pattern and potentially expose the $45 zone.
Presently, SOL maintains position within its current support corridor between $80 and $90, with the $106.24 level standing as the next significant hurdle for bullish momentum to overcome.