
 Plunges 5% as Geopolitical Crisis Tests Key Support Levels")
TLDR
- Solana currently trades at roughly $78, down 72% from its all-time high of $295
- SOL spot ETF products show minimal damage with only $11.3M total outflows, contrasting sharply with Bitcoin and Ethereum ETFs that saw four consecutive months of net redemptions
- The Solana blockchain led DEX trading volume with $108 billion over 30 days, eclipsing Ethereum’s $63.7 billion
- Chart analysts point to major support zones at $50, $22, and $10 based on Parallel Channel technical patterns
- Escalating military conflict between Israel and Iran triggered massive crypto liquidations, pushing Bitcoin toward $60,000 and pressuring altcoins like SOL
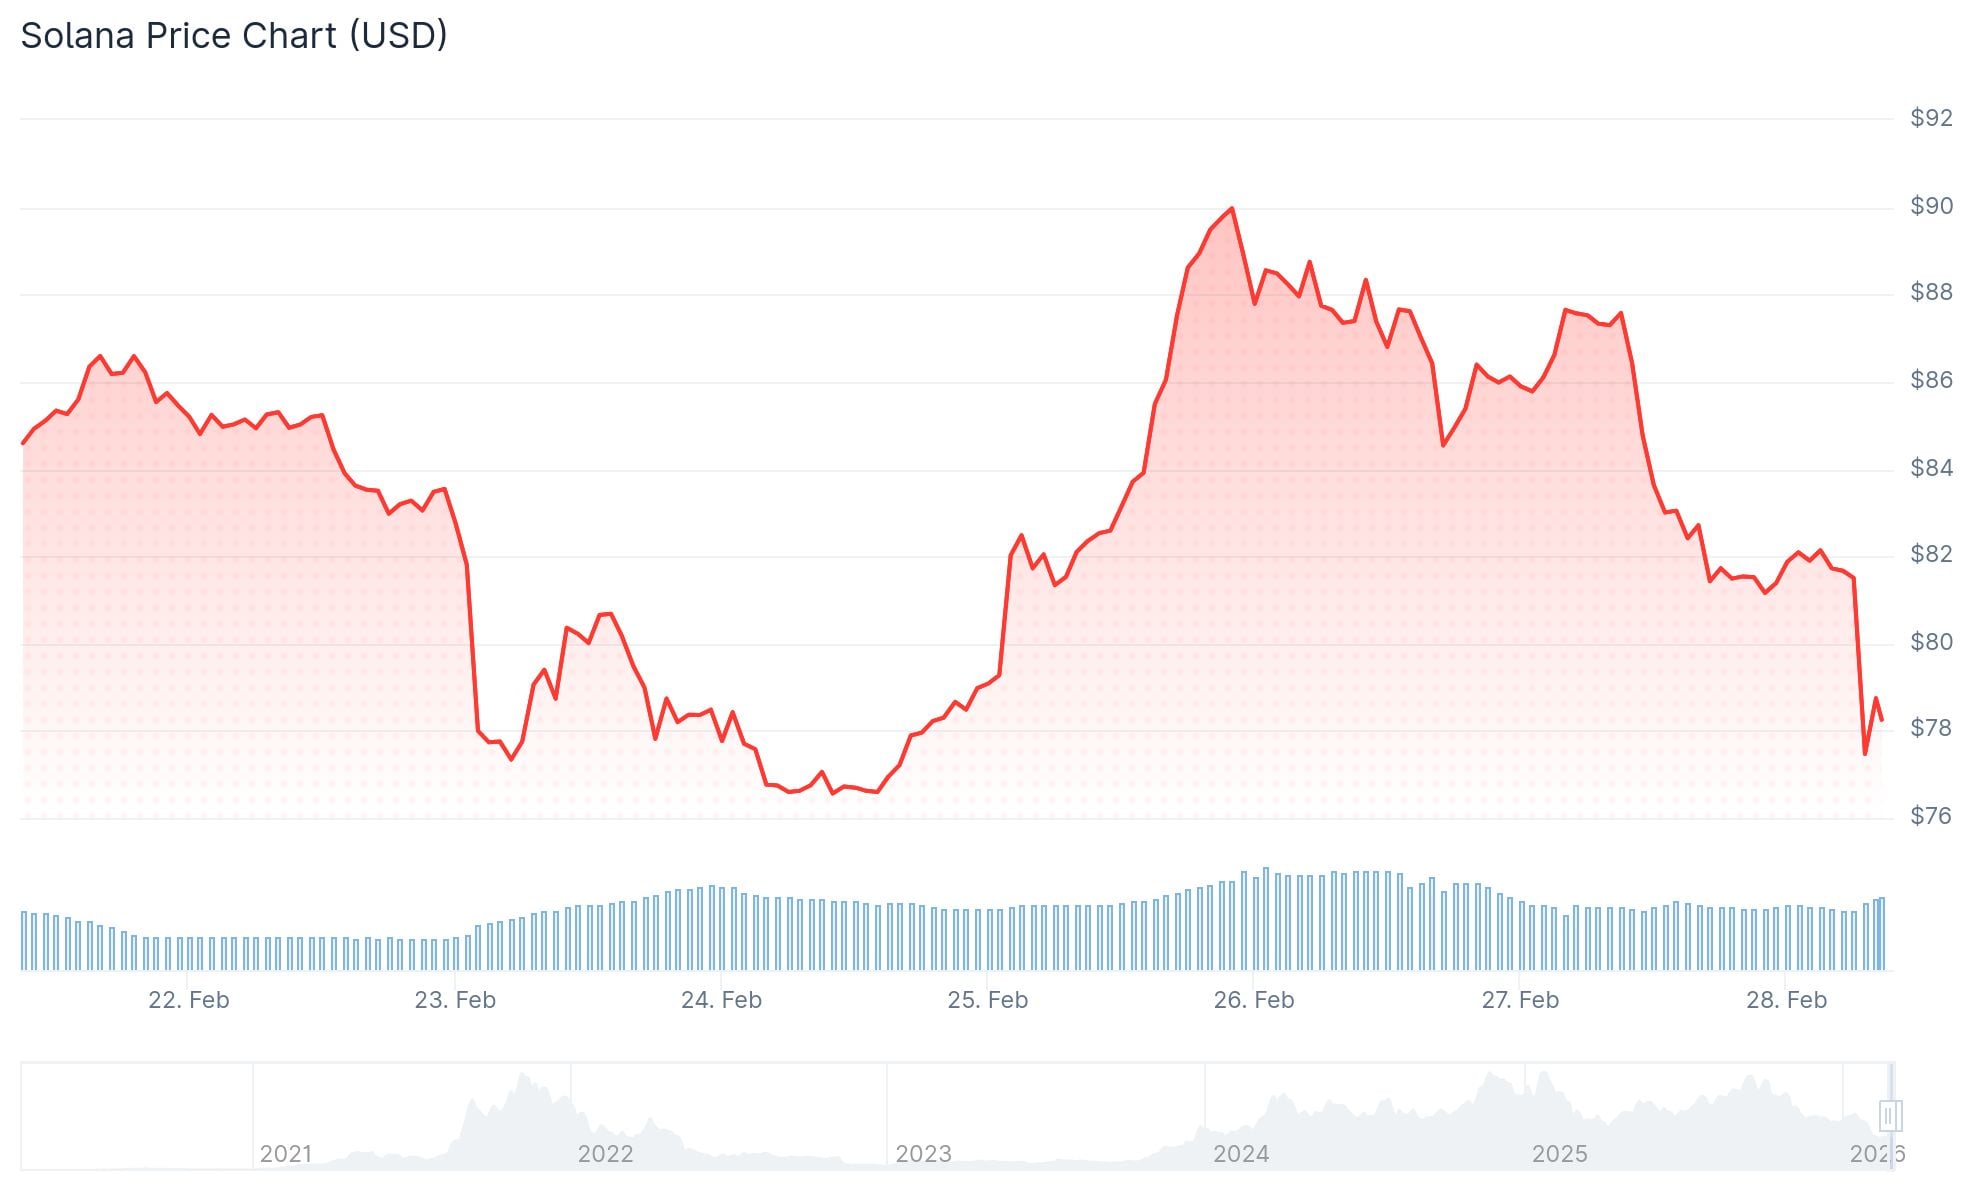
Solana’s native cryptocurrency SOL currently hovers around $78, marking a dramatic 72% retreat from its all-time high of $295. The selloff intensified during a broader digital asset market downturn fueled by heightened geopolitical tensions on February 28, 2026.
Israeli military forces launched strikes against Iranian facilities on Saturday morning. According to AP intelligence sources, the United States participated in these coordinated operations. Bitcoin plummeted 5% within moments, nearing the $60,000 mark, triggering panic selling that rippled through altcoins including SOL.
Despite the bearish price movement, Solana’s underlying blockchain performance remains impressive. The network processed $108 billion in DEX trading volume during the last 30 days, significantly outperforming Ethereum’s $63.7 billion and Base’s $31.48 billion.
Over the past day, Solana-based protocols generated $3.1 million in fees versus Ethereum’s $2.95 million. Active wallet addresses on Solana reached 2.17 million, dramatically exceeding Ethereum’s 682,236 active users.
Solana’s real-world asset tokenization sector hit a fresh record of $1.71 billion, representing a 45% monthly gain.
SOL ETF Flows Hold Steady
SOL exchange-traded funds launched in late October 2025, capturing over $100 million in average daily net inflows during their first five weeks. Weekly inflows have since stabilized in the $20–$25 million range as prices declined.
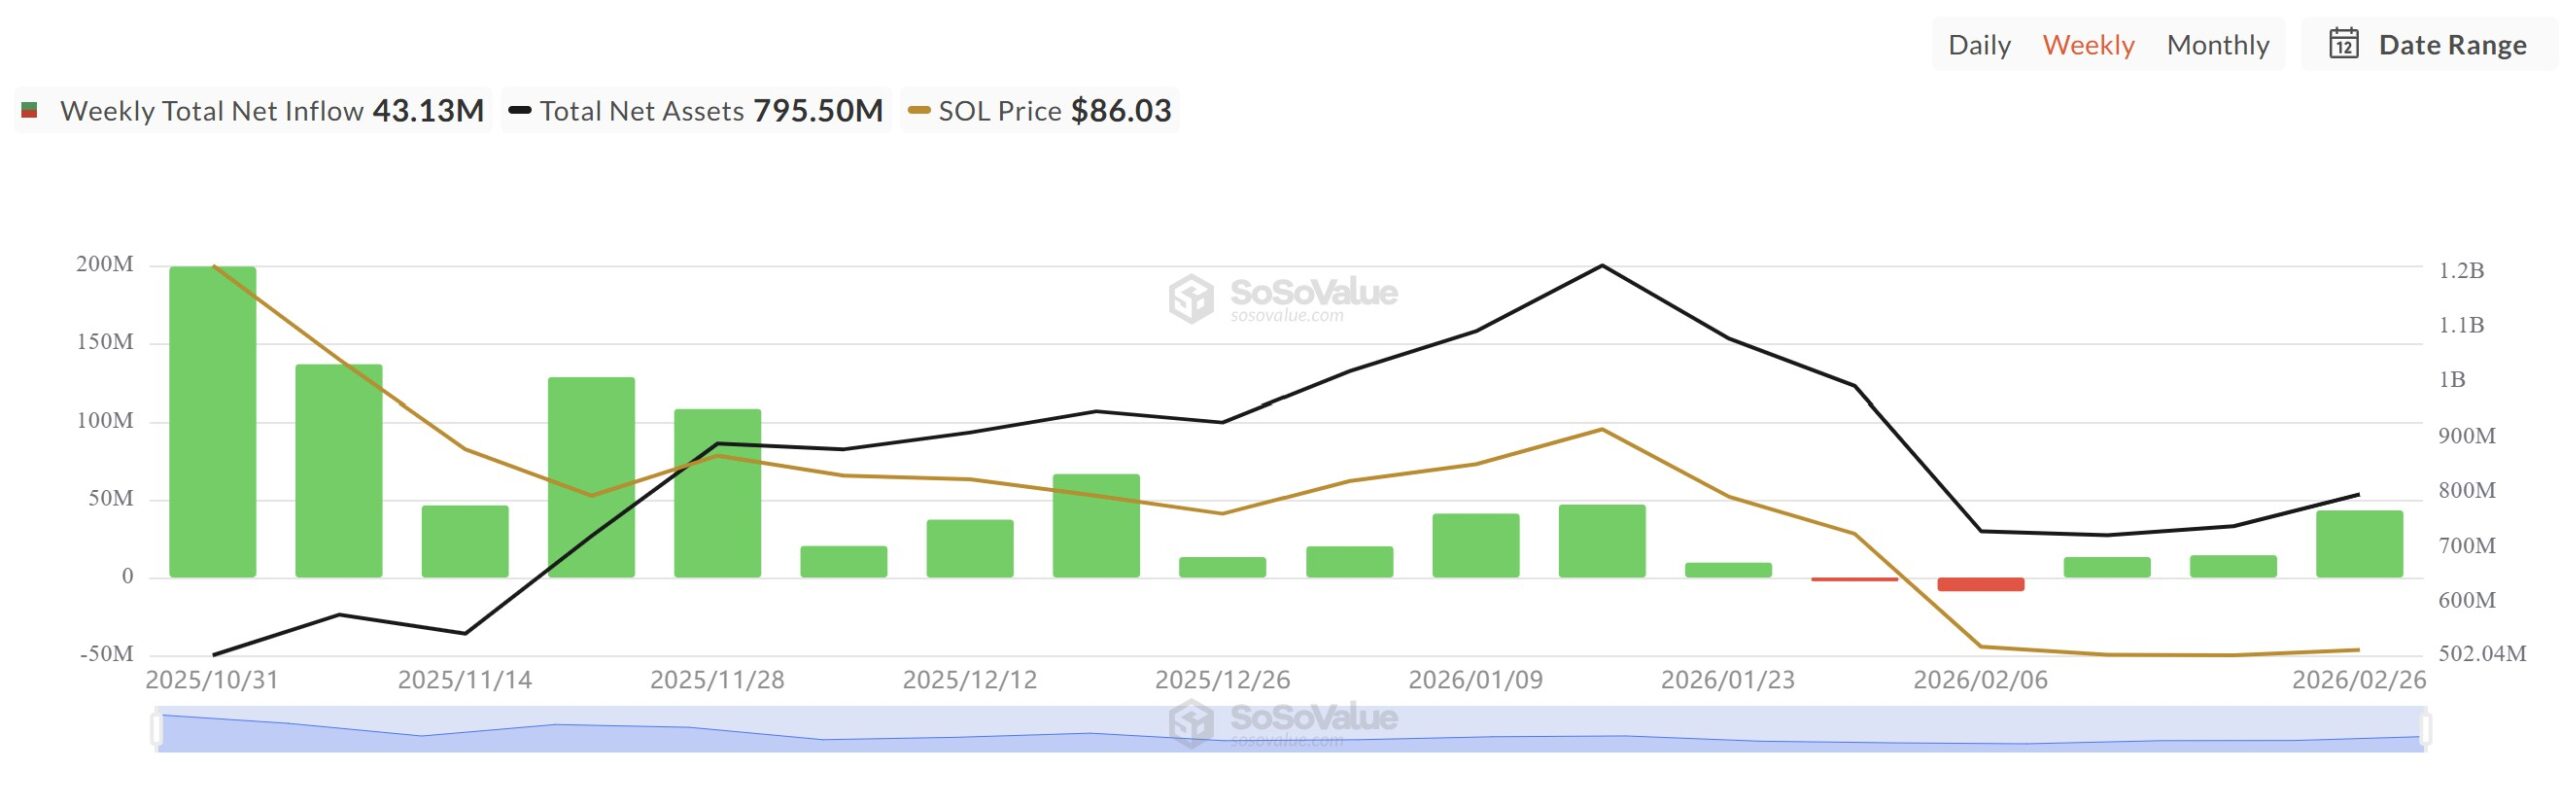
Cumulative outflows during the four-month correction total just $11.3 million across a two-week period. By comparison, Bitcoin and Ethereum ETF products experienced four straight months of net outflows during the same window.
Solana now trades well below the $188 price point seen when ETF products first launched.
Key Support Levels to Watch
Crypto analyst Ali Martinez has spotted a Parallel Channel pattern forming on SOL’s weekly timeframe. This technical structure suggests potential support targets at $50.22, $22.47, and $9.98.
Crypto Scient, another analyst, has highlighted two additional zones worth monitoring. The first corresponds to the 0.75 Fibonacci retracement between $60 and $70. The second represents a weekly demand fair value gap from $22 to $29.
Glassnode’s UTXO data reveals that more than 6% of SOL’s circulating supply last moved at current price levels. The next major supply cluster, exceeding 3%, sits between $20 and $30.
SOL remains below the weekly resistance level at $120. The $51 to $80 weekly range has been tested multiple times and aligns with the retracement zone analysts are monitoring.
As of February 28, 2026, SOL held at $78 as crypto markets digested news from the Israel-Iran military confrontation.