
 Faces Six Rejections at $90 — Could $50 Be the Next Stop?")
Contents
Key Takeaways
- Solana has declined 33% in 2025, ranking as the poorest performer among the top five cryptocurrencies
- On-chain activity has contracted for nine straight weeks, sitting 32% lower than its February high
- Sellers have successfully blocked upward momentum above $90 on six separate occasions; SOL remains confined between $77 and $90
- The weekly RSI indicator moved above its signal line in mid-April, echoing a formation that preceded a 2,400% surge in 2022
- Historical precedent suggests SOL may decline to the $50 range before beginning its next significant uptrend
Solana (SOL) currently trades around the $84 level following a bounce from $81.40, which provided temporary support for a mild rebound. The asset pushed back above $83.50 and successfully breached a descending trend line that had acted as resistance near $83.45 on the one-hour timeframe.
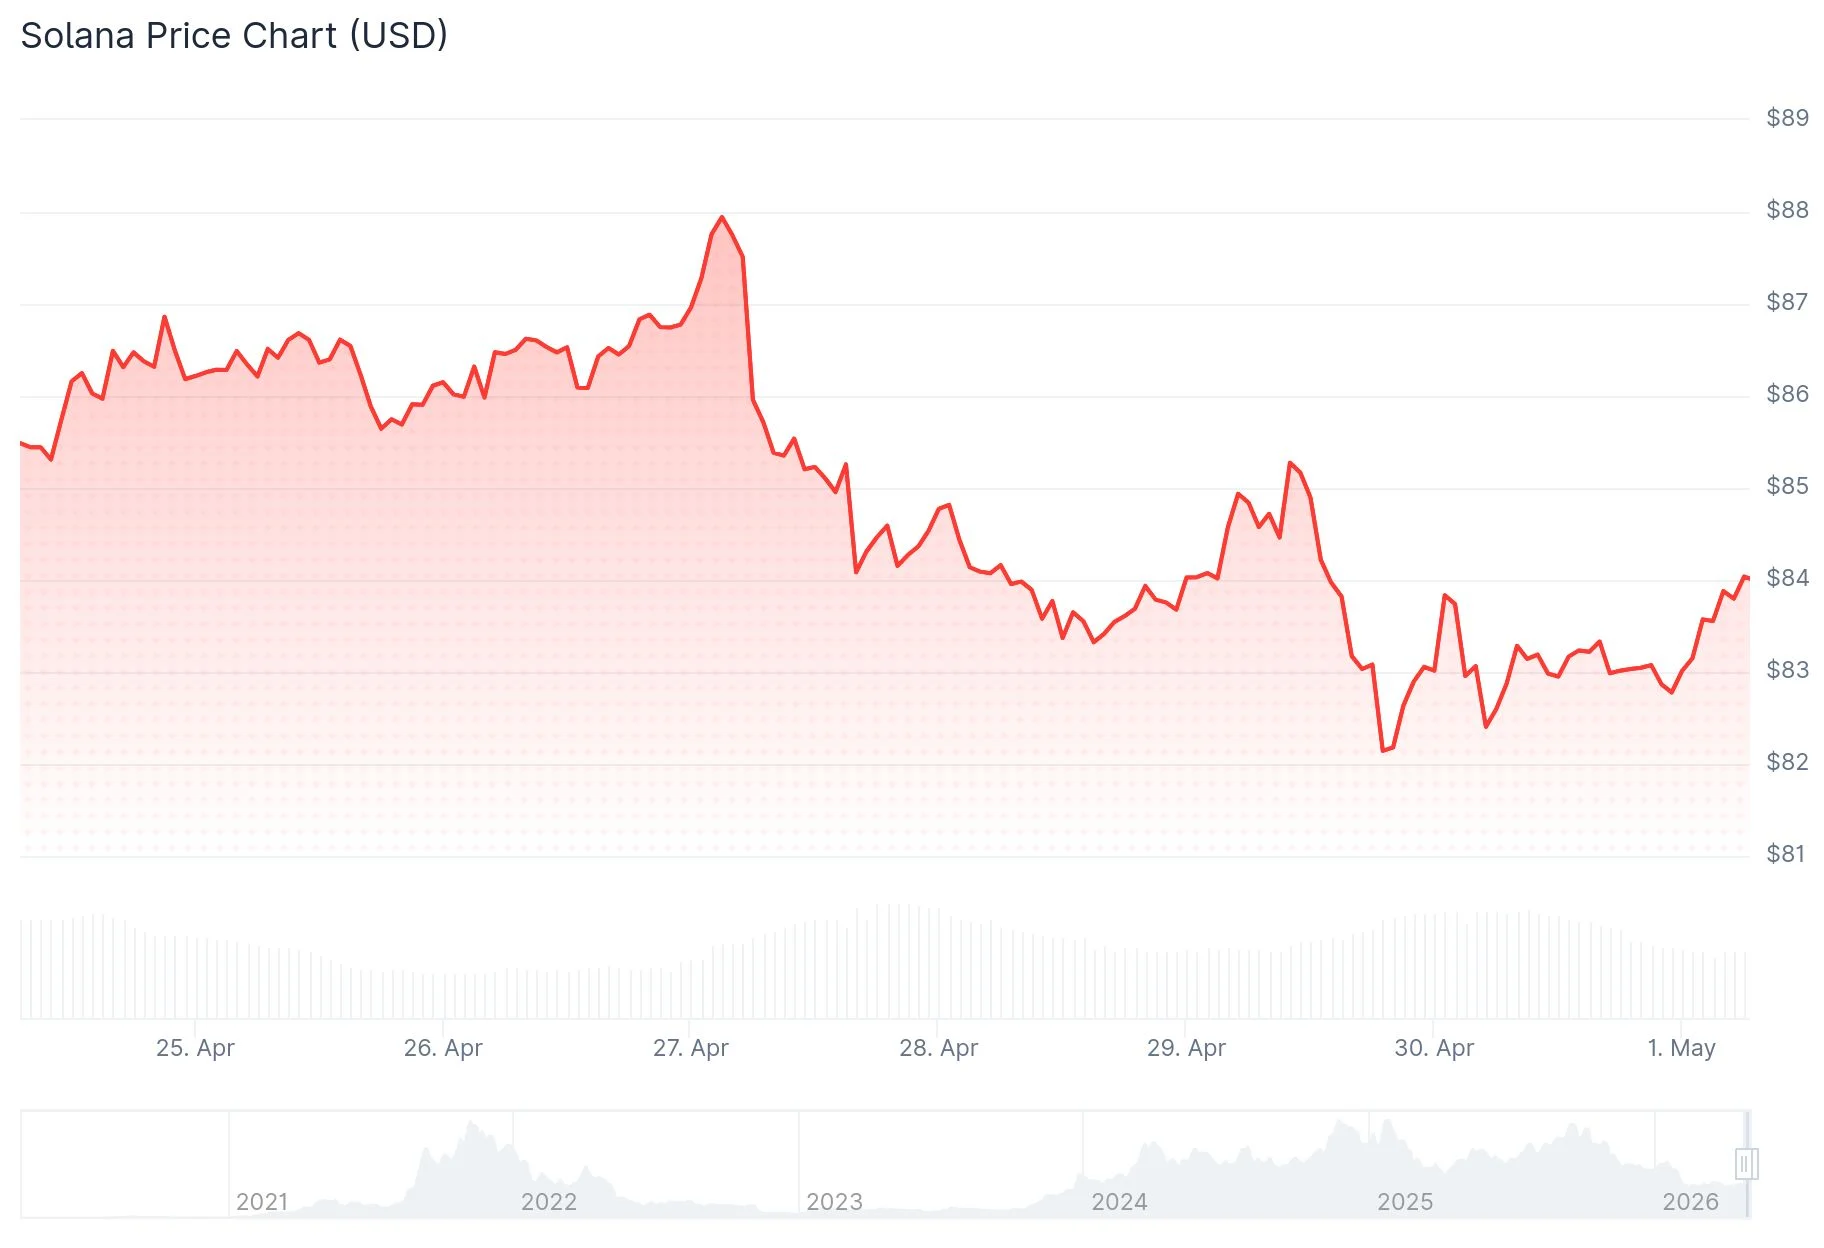
This upward movement coincided with comparable recoveries in both Bitcoin and Ethereum. SOL managed to reclaim the 50% Fibonacci retracement level from its latest decline spanning $85.48 down to $81.40.
However, selling pressure persists beneath the $85 threshold. The nearest resistance zone stands at $84.50, followed by a more substantial barrier at $85.50. Bulls would need to push through $87 to establish a path toward $92 and potentially $102.
Should SOL prove unable to penetrate $85.50, key support levels include $83.45, followed by $82.50, and then $81.40. A decisive break below $81.40 would likely accelerate downside movement toward the $77 region.
Declining On-Chain Metrics Paint Bearish Picture
Blockchain data reveals a concerning trend for Solana. Transaction activity has contracted for nine uninterrupted weeks. Current levels rest 32% beneath the 959 million transaction peak recorded during the week that concluded on February 8.
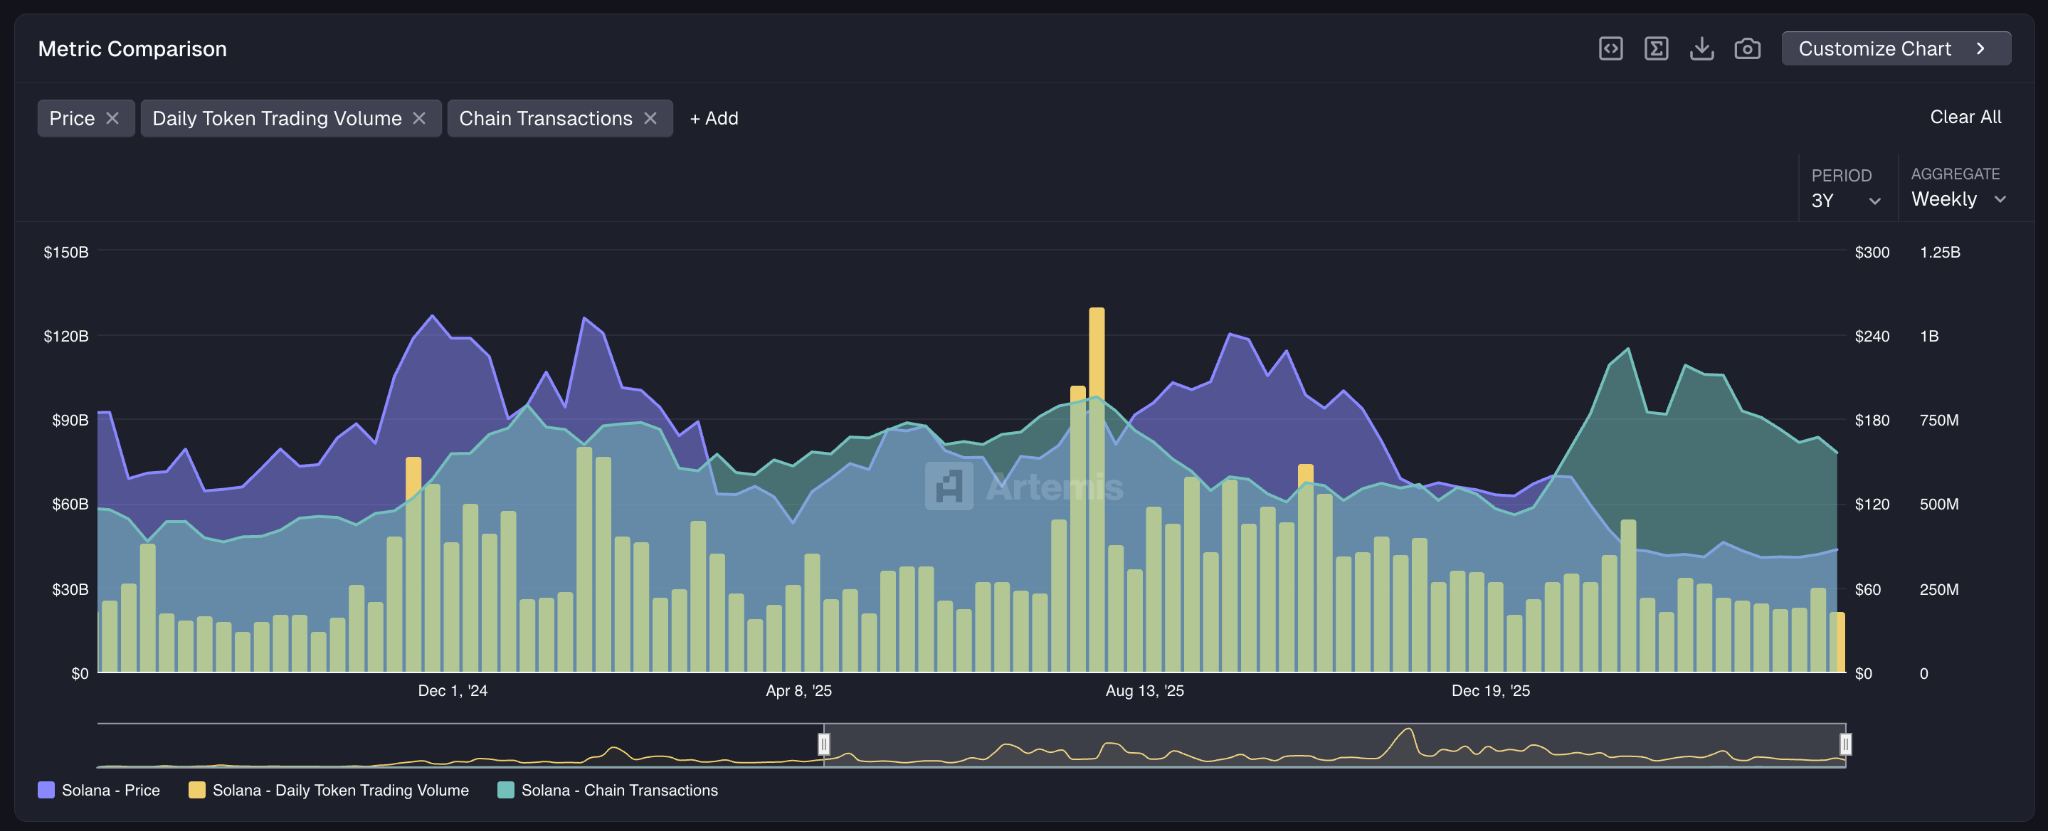
Trading volumes remain suppressed as well. The previous week registered $22 billion in SOL exchange activity — roughly half the volume observed throughout the April–September 2025 bull cycle, and merely 20% of historical highs.
Solana significantly lagged during April’s market recovery. While Bitcoin advanced 14% and Ethereum climbed 10%, SOL managed just a 2.8% increase.
For the year, SOL has surrendered 33% of its value, establishing it as the weakest performer within the top five digital assets by market capitalization.
Challenging Macroeconomic Backdrop
Broader economic conditions continue applying downward pressure on alternative cryptocurrencies. The PCE Price Index accelerated from 2.8% in February to 3.5% in March, reflecting elevated inflation primarily fueled by rising energy expenses. Crude oil prices have climbed back above $100 per barrel amid the ongoing U.S. blockade affecting the Strait of Hormuz.
The Federal Reserve maintained interest rates at its most recent policy meeting, with market participants expecting no reductions throughout the remainder of this year. Jerome Powell delivered his concluding remarks as Fed Chair, while FOMC members displayed notable disagreement regarding future policy direction.
Market participants are gravitating away from higher-risk investments. Funds continue flowing primarily into Bitcoin and Ethereum, leaving limited demand for alternative assets such as SOL.
Technical Indicator Suggests Potential Decline to $50
Solana’s weekly RSI reached oversold territory at 30 back in February and subsequently crossed above its 14-week moving average during mid-April. A strikingly similar technical formation materialized in November 2022 — however, before that eventual rally commenced, SOL first dropped from $13 down to $9.
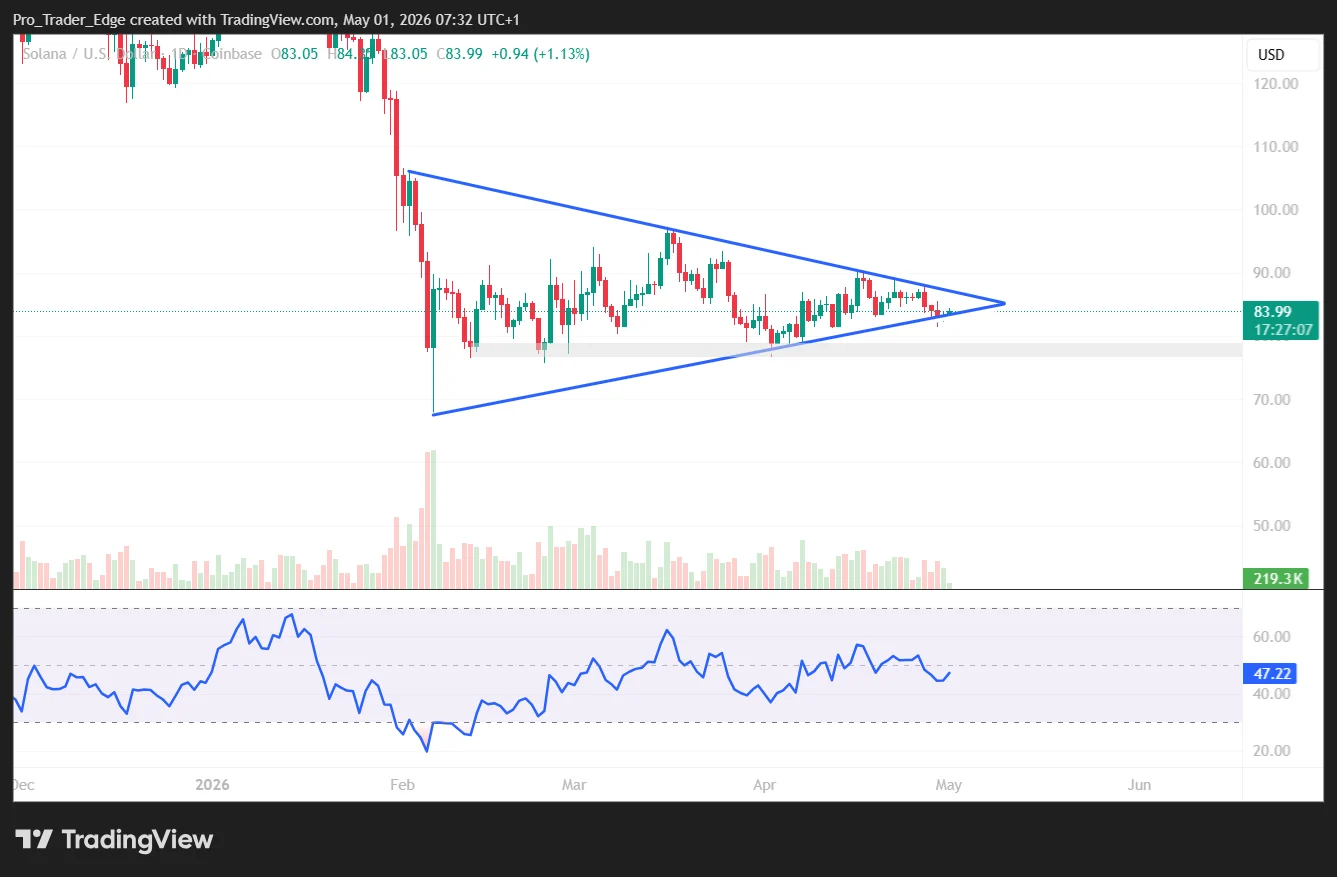
Should this historical pattern repeat itself, SOL may decline toward the low-to-mid $50s before establishing a foundation for its next substantial upward movement.
SOL has remained trapped within a $77 to $90 trading range for the past two months. Multiple attempts by buyers to break above $90 have been met with aggressive selling pressure. The asset continues consolidating within this tight corridor.