
 Faces 5% Decline Amid Middle East Tensions – Critical Support Levels in Focus")
TLDR
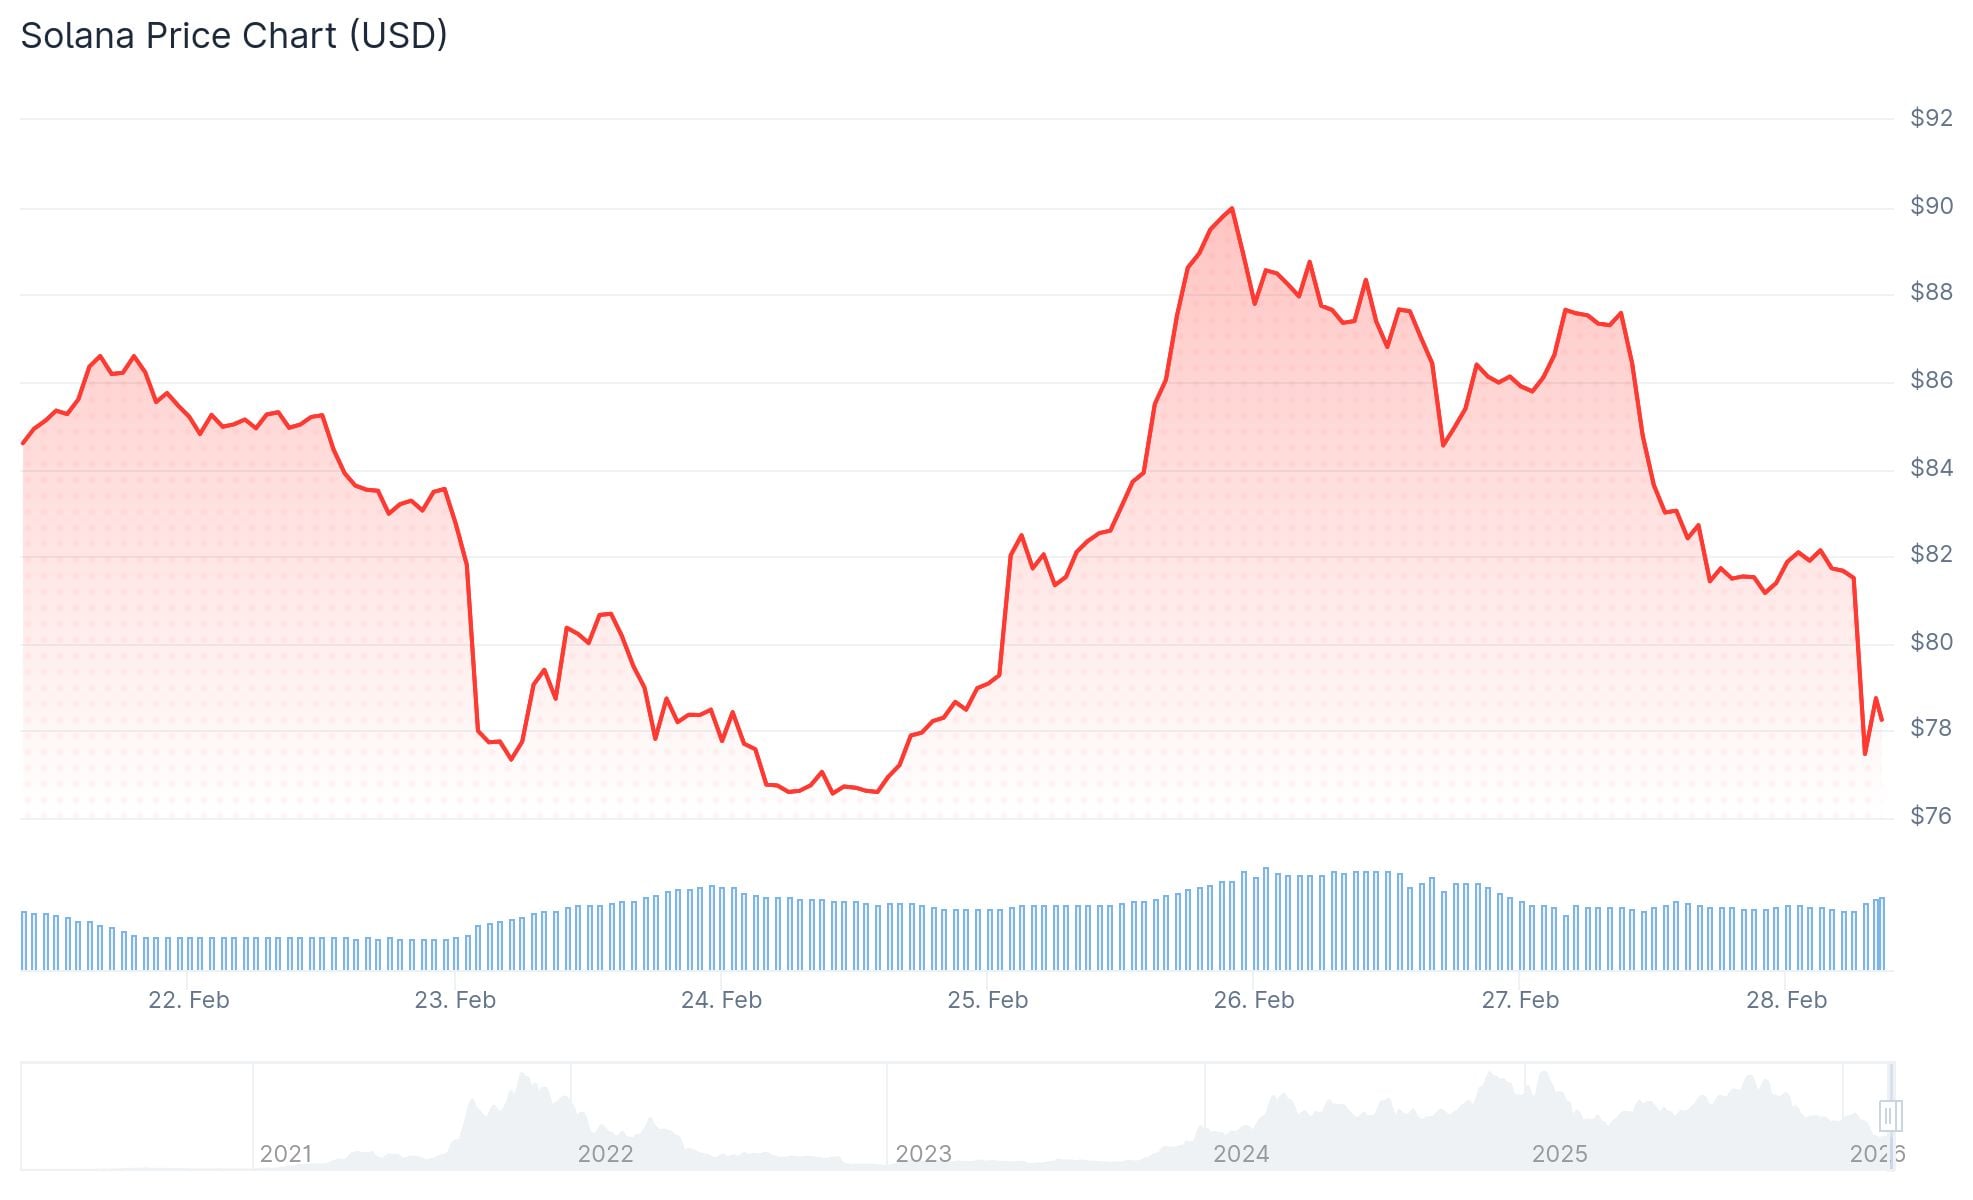
- SOL has declined 72% from its peak of $295, currently hovering around $78
- Solana ETF products have experienced only $11.3M in outflows, significantly less than Bitcoin and Ethereum ETFs during their four-month downturn
- The network dominated DEX trading with $108 billion in volume over 30 days, surpassing Ethereum’s $63.7 billion
- Technical analysts highlight critical support zones at $50, $22, and $10 using Parallel Channel analysis
- Geopolitical escalation between Israel and Iran sparked widespread crypto liquidations, with Bitcoin approaching $60,000 and amplifying altcoin weakness
The SOL token from Solana is presently valued at $78, representing a 72% decline from its record high of $295. This downturn coincides with a wider cryptocurrency market correction, exacerbated by geopolitical instability on February 28, 2026.
Saturday morning local time saw Israel execute a military operation against Iran. According to sources from the Associated Press, the United States joined the offensive. Bitcoin experienced a sharp 5% decline within minutes, plunging toward the $60,000 threshold, while the resulting market panic affected alternative cryptocurrencies including SOL.
While prices have suffered, Solana’s on-chain metrics continue to demonstrate resilience. The network facilitated $108 billion in decentralized exchange volume during the previous 30-day period, outpacing Ethereum’s $63.7 billion and Base’s $31.48 billion.
During the last 24-hour period, Solana’s applications generated $3.1 million in revenue compared to Ethereum’s $2.95 million. The platform recorded 2.17 million active addresses, significantly exceeding Ethereum’s 682,236 addresses.
The real-world asset ecosystem on Solana has achieved a record valuation of $1.71 billion, marking a 45% surge over the past month.
SOL ETF Flows Remain Relatively Stable
Spot Solana ETF products debuted in late October 2025, attracting more than $100 million in average net inflows throughout their initial five-week period. Weekly capital inflows have subsequently moderated to the $20–$25 million range as prices retreated.
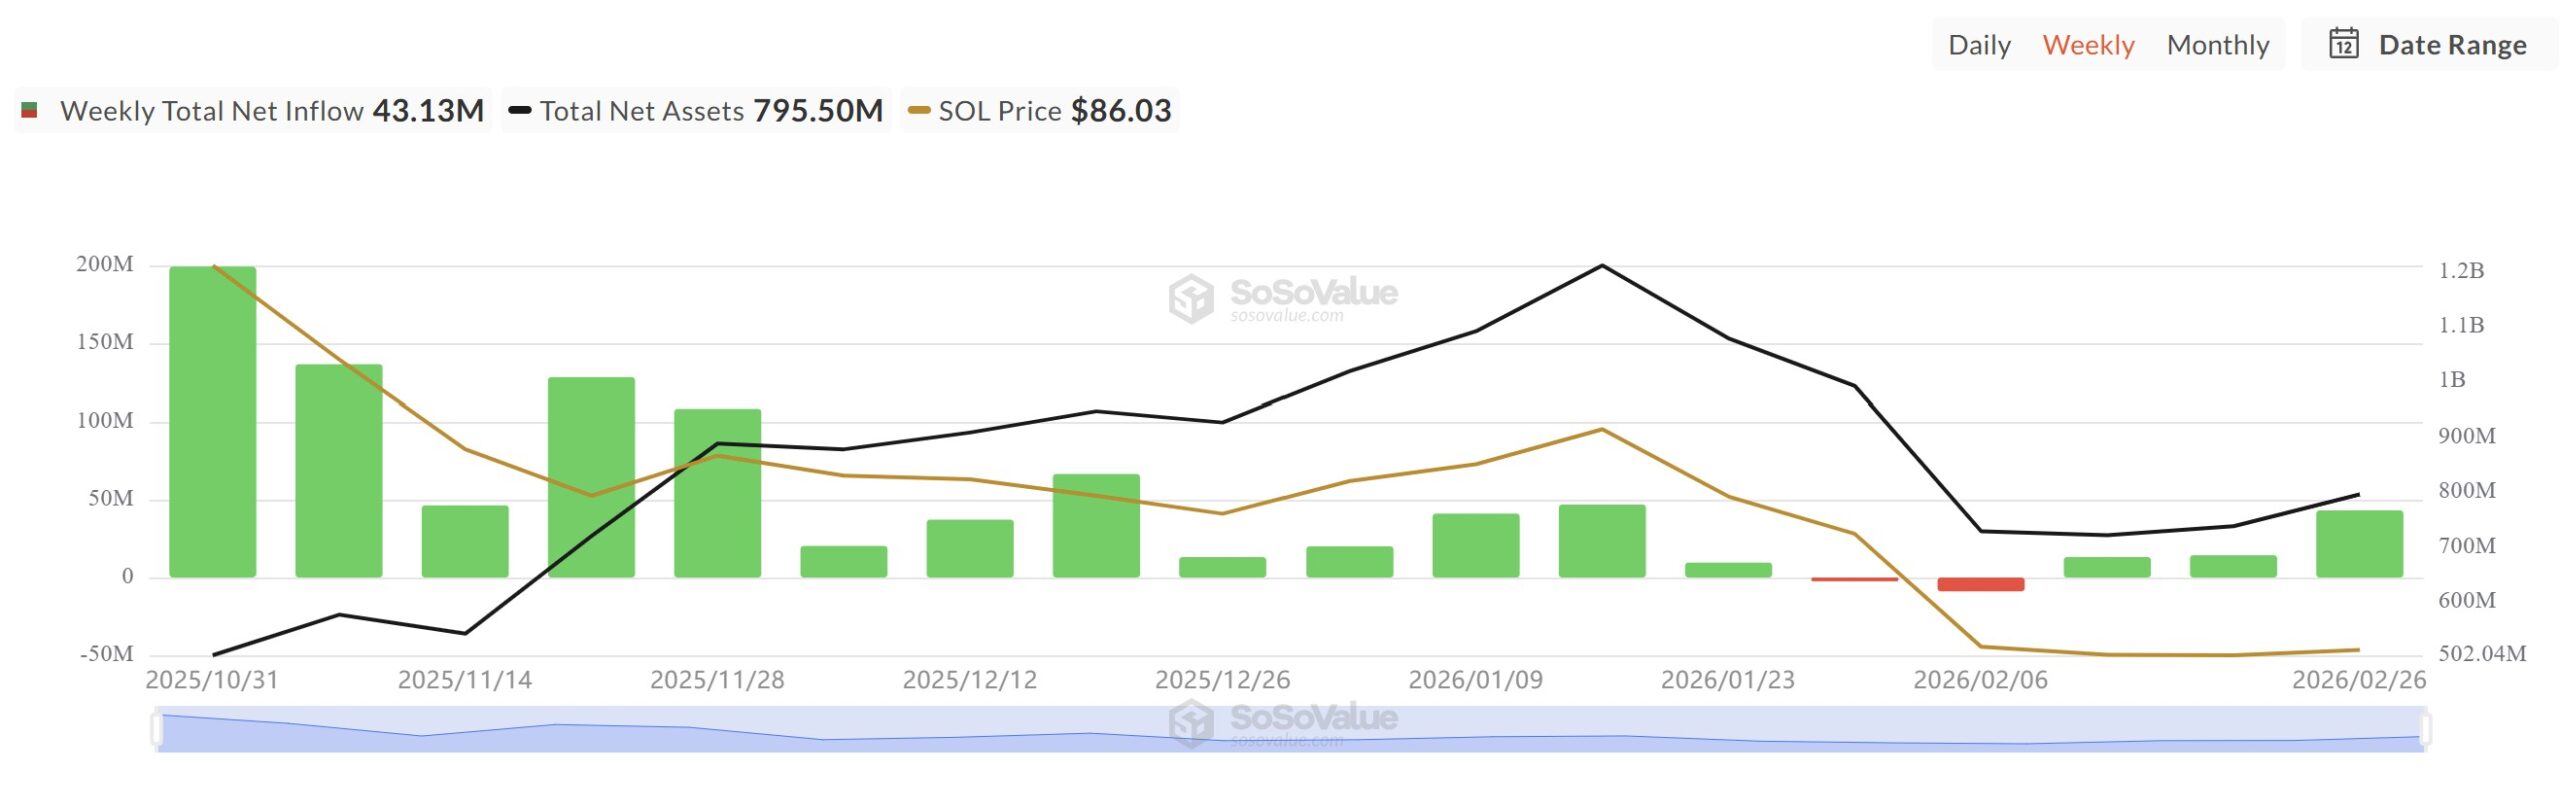
Total outflows during the four-month correction period amount to merely $11.3 million spread over two weeks. In comparison, Bitcoin and Ethereum ETF products experienced four straight months of negative capital flows during this same timeframe.
Solana currently trades significantly beneath the $188 price point observed during its ETF product launch.
Critical Support Zones Under Surveillance
Market analyst Ali Martinez highlighted a Parallel Channel formation developing on SOL’s weekly timeframe. This technical pattern suggests potential support levels at $50.22, $22.47, and $9.98.
Analyst Crypto Scient pinpointed two supplementary areas of interest. The initial zone represents the 0.75 Fibonacci retracement level spanning $60 to $70. The secondary area identifies a weekly demand fair value gap ranging between $22 and $29.
Glassnode’s UTXO analysis reveals that more than 6% of SOL’s circulating supply last transacted within the present price range. The subsequent significant supply concentration, exceeding 3%, resides in the $20 to $30 corridor.
SOL presently trades beneath the weekly resistance threshold of $120. The $51 to $80 range on weekly charts has undergone testing and corresponds with the retracement area under analyst scrutiny.
As of February 28, 2026, SOL was changing hands at $78 while markets processed developments from the Israel-Iran military engagement.