
 Exchange Deposits Spike 800% — Could We See $65 Next?")
Key Takeaways
- Solana has declined more than 30% year-to-date, with consecutive rallies producing progressively lower peaks
- Negative funding rates have persisted for 21 consecutive weeks, echoing a 2022 configuration that preceded a significant upward move
- Open interest has plummeted from $7.58 billion down to $1.9 billion, leaving minimal ammunition for a potential short squeeze
- Daily exchange deposits have skyrocketed 800% since February, climbing from 245,691 SOL to more than 2.2 million SOL
- Critical support zones are positioned at $82 and $75, with analysts eyeing $65 as a potential downside target if these levels fail
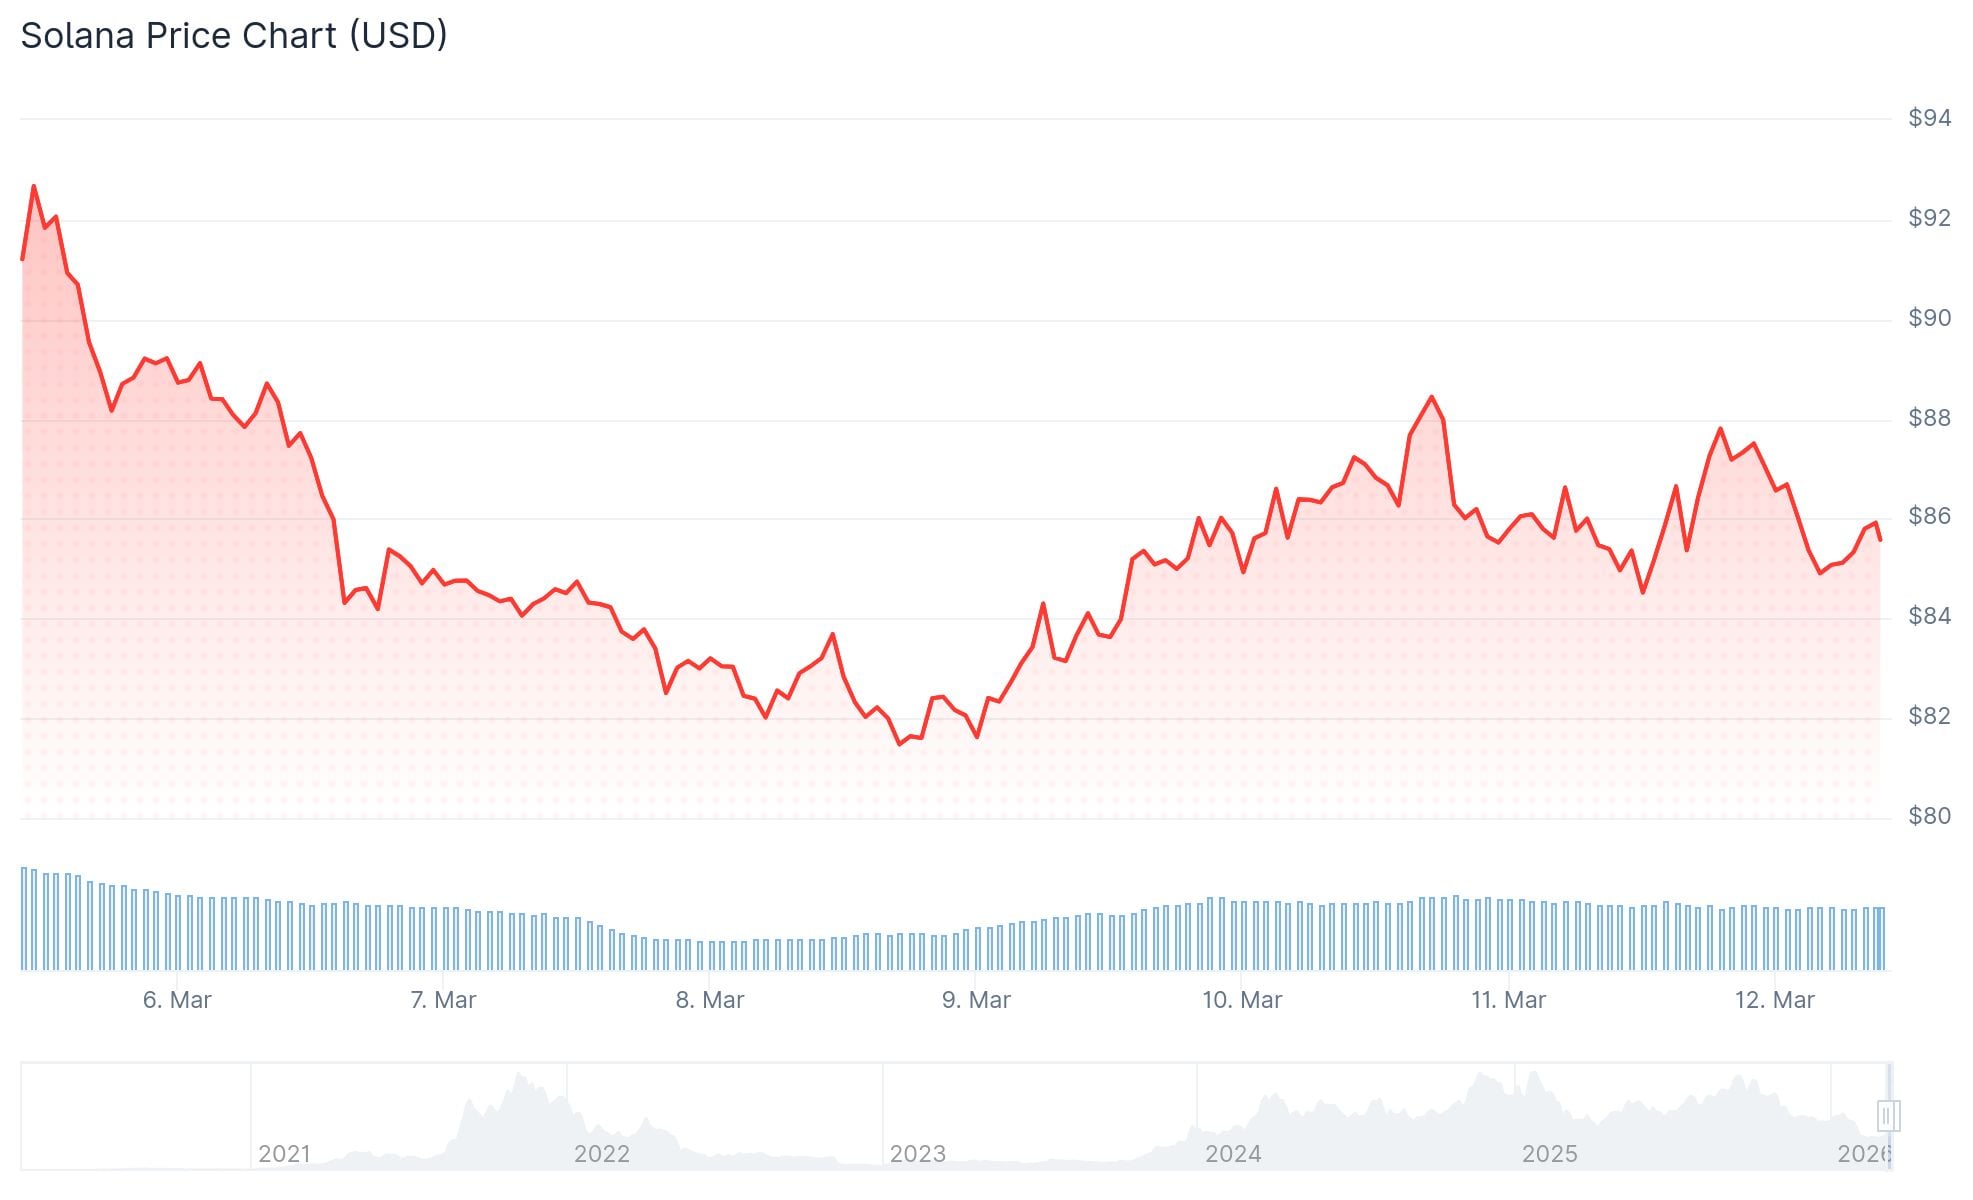
Over the last month, Solana has displayed relative stability, registering only a 1.4% decline. However, zooming out reveals a more concerning narrative. SOL has shed over 30% of its value since the start of 2026, with each upward movement stalling at progressively weaker resistance levels.
Beneath the surface of this short-term equilibrium, significant bearish forces are accumulating.
A crucial futures market indicator — the funding rate — has remained in negative territory for 21 consecutive weeks. When funding rates turn negative, it indicates that traders holding short positions are compensating those with long positions. This dynamic reflects dominant bearish sentiment in the derivatives market.
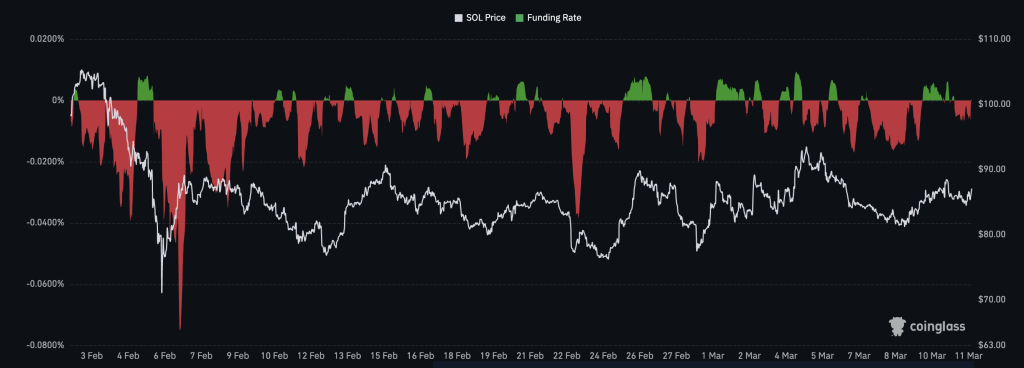
This configuration mirrors a previous extended period between February 2022 and February 2023, when negative funding persisted for 53 weeks. Throughout that prolonged bearish phase, SOL plummeted to a cycle bottom of $7. However, as that extended streak concluded, the price quietly started recovering — eventually surging to $209 by March 2024.
The current 21-week negative funding streak shares structural similarities with that earlier period. However, a critical distinction exists.
Leverage Has Evaporated from the Market
Derivatives open interest for SOL reached its zenith at $7.58 billion in September 2025. Currently, it hovers around $1.9 billion — representing the lowest level since early March 2025. This constitutes an approximately 75% contraction.
Diminished open interest indicates insufficient leveraged short positions to catalyze a substantial short squeeze. Without this potential catalyst, price recoveries typically lack sustainability and momentum.
On the technical chart, SOL has been confined within an ascending channel structure since early February. While this pattern might superficially suggest recovery, it developed immediately following a precipitous decline from $148 to $68. Technical analysts interpret this formation as a bearish continuation pattern rather than a bullish reversal signal.

Token Deposits to Exchanges Accelerating
Blockchain data reinforces the bearish outlook. Exchange net inflows for Solana have registered positive values continuously since February 10. On that initial date, daily inflows measured approximately 245,691 SOL. By March 10, this figure had escalated to 2,204,783 SOL — representing an approximately 800% surge within a single month.
Tokens migrating to centralized exchanges generally indicates that holders are positioning to liquidate their holdings.
For a genuine market bottom to establish itself, analysts suggest these inflows would need to transition into consistent outflows. This reversal has not yet materialized.
Immediate support levels are located at $82, followed by $79. Should these thresholds fail to hold, the projected channel measurement indicates a potential move toward $65.
On the resistance side, a daily closing price above $94 would interrupt the pattern of descending highs. A breakthrough above $118 would be required to validate a complete trend reversal to bullish territory.
As of March 11, 2026, SOL is trading around $85, with exchange inflows continuing their upward trajectory and open interest remaining near multi-month lows.