
 Consolidates for a Month: Will Bulls or Bears Win the Breakout Battle?")
Key Takeaways
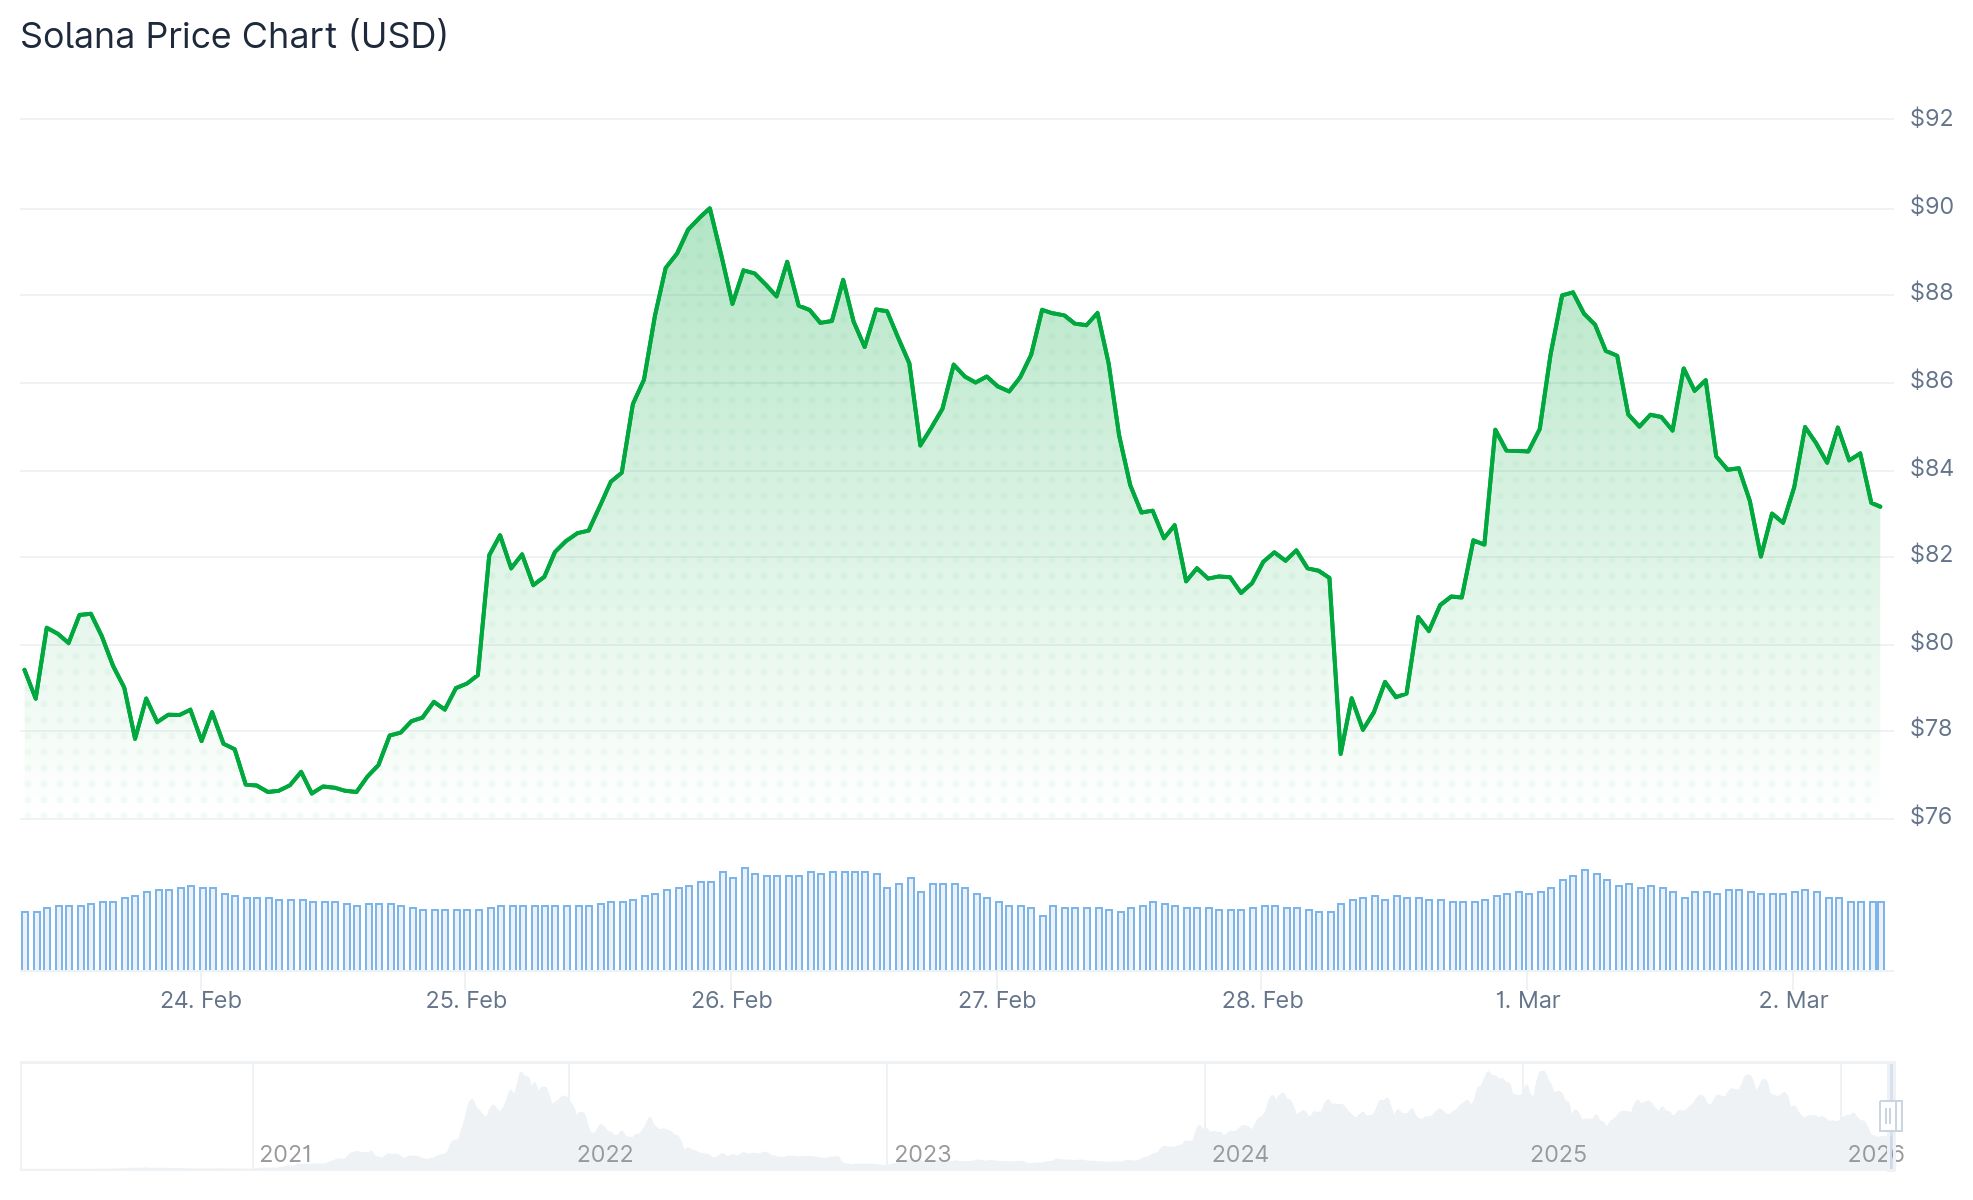
- Solana (SOL) remains confined within a $77–$88 price corridor for approximately four weeks without establishing a definitive trend
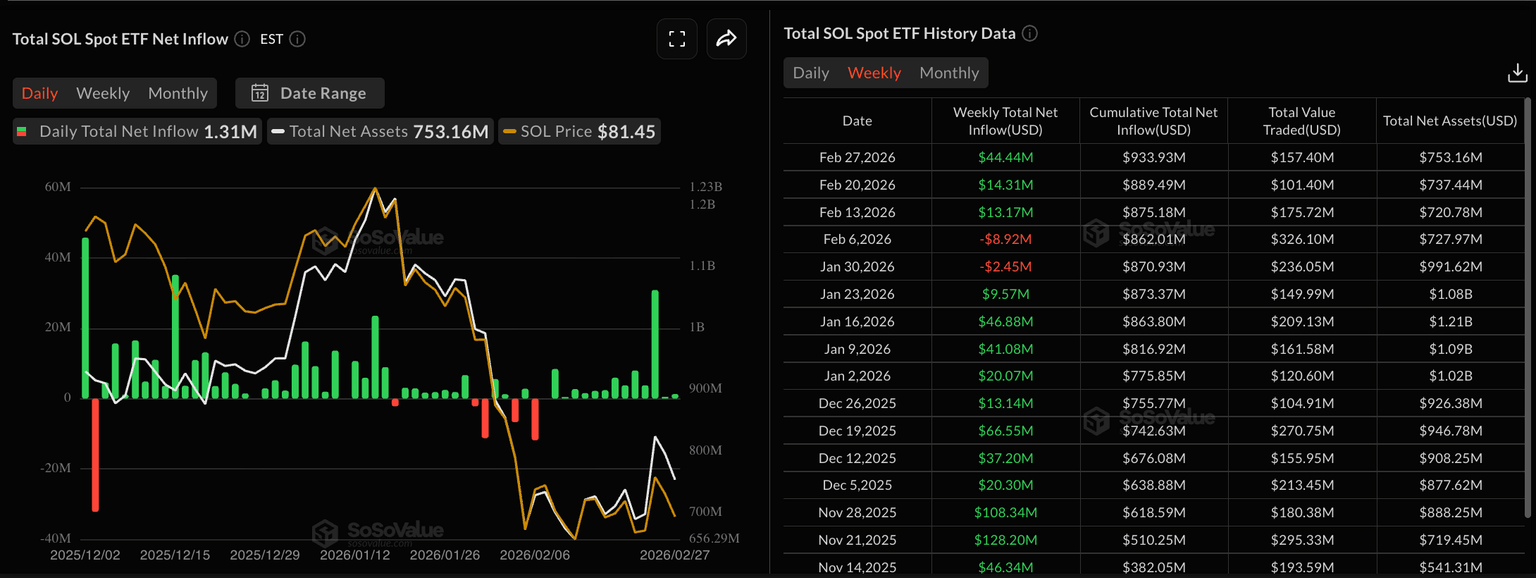
- Spot Solana ETFs in the United States attracted more than $44 million in weekly capital, pushing total year-to-date inflows beyond $900 million
- Open Interest in SOL futures contracts declined over 6% within a 24-hour period, accompanied by $26.47 million in liquidations predominantly affecting bullish positions
- Technical indicators show Bollinger Bands contracting, typically a precursor to increased volatility and a directional move
- New daily addresses on the Solana network increased by 1.4 million across 12 days, climbing to 8.6 million and indicating expanding adoption
Solana (SOL) continues to hover around the $84–$85 mark as of March 2, 2026, maintaining its position within a consolidation pattern that has persisted for roughly four weeks. Price action has oscillated between the $77 support and $88 resistance levels without establishing a clear breakout.
While price movement remains subdued, institutional capital continues flowing into the asset. Spot Solana exchange-traded funds in the United States accumulated $44.44 million in net inflows throughout the previous week, highlighted by a single-day influx of $30.86 million on Wednesday.
Year-to-date aggregate inflows into these ETF products have now crossed the $900 million threshold. Throughout February, the funds recorded net positive inflows for over 12 consecutive trading sessions, contrasting sharply with Bitcoin and Ethereum ETF products that experienced capital outflows during the same timeframe.
Retail trader activity paints a contrasting picture. Open Interest in SOL futures contracts dropped more than 6% over a 24-hour stretch to $4.89 billion, suggesting position unwinding among derivatives traders.
Liquidations totaled $26.47 million during this period, with long positions accounting for $20.47 million of that figure. This data reflects a significant shakeout of bullish leveraged bets.
Despite the liquidation cascade, funding rates remain at 0.0037–0.0041%, indicating that traders with leveraged long positions continue paying a slight premium to maintain their exposure.
Critical Technical Thresholds
SOL continues trading beneath both its 50-day and 200-day Exponential Moving Averages, positioned at $99.06 and $137.23 respectively. Both averages currently function as resistance barriers.
The Relative Strength Index registers approximately 43, positioned below the neutral threshold of 50. The MACD histogram indicates diminishing bearish pressure but has yet to generate a bullish crossover signal.
Bollinger Bands display noticeable compression on the daily timeframe. Such band squeezes frequently precede significant price movements, although the ultimate direction remains undetermined.
Market analyst Umair Crypto highlighted a divergence between SOL’s performance against USDT versus BTC. The USDT pair displays lower highs in its price structure, while the BTC pair exhibits higher highs — a discrepancy that has persisted for 24 days.
Blockchain Metrics Indicate Growing Adoption
Blockchain analytics from Glassnode reveal that daily new Solana addresses expanded by 1.4 million throughout the previous 12-day period, bringing the cumulative total to 8.6 million. This metric points toward strengthening user participation across the network.
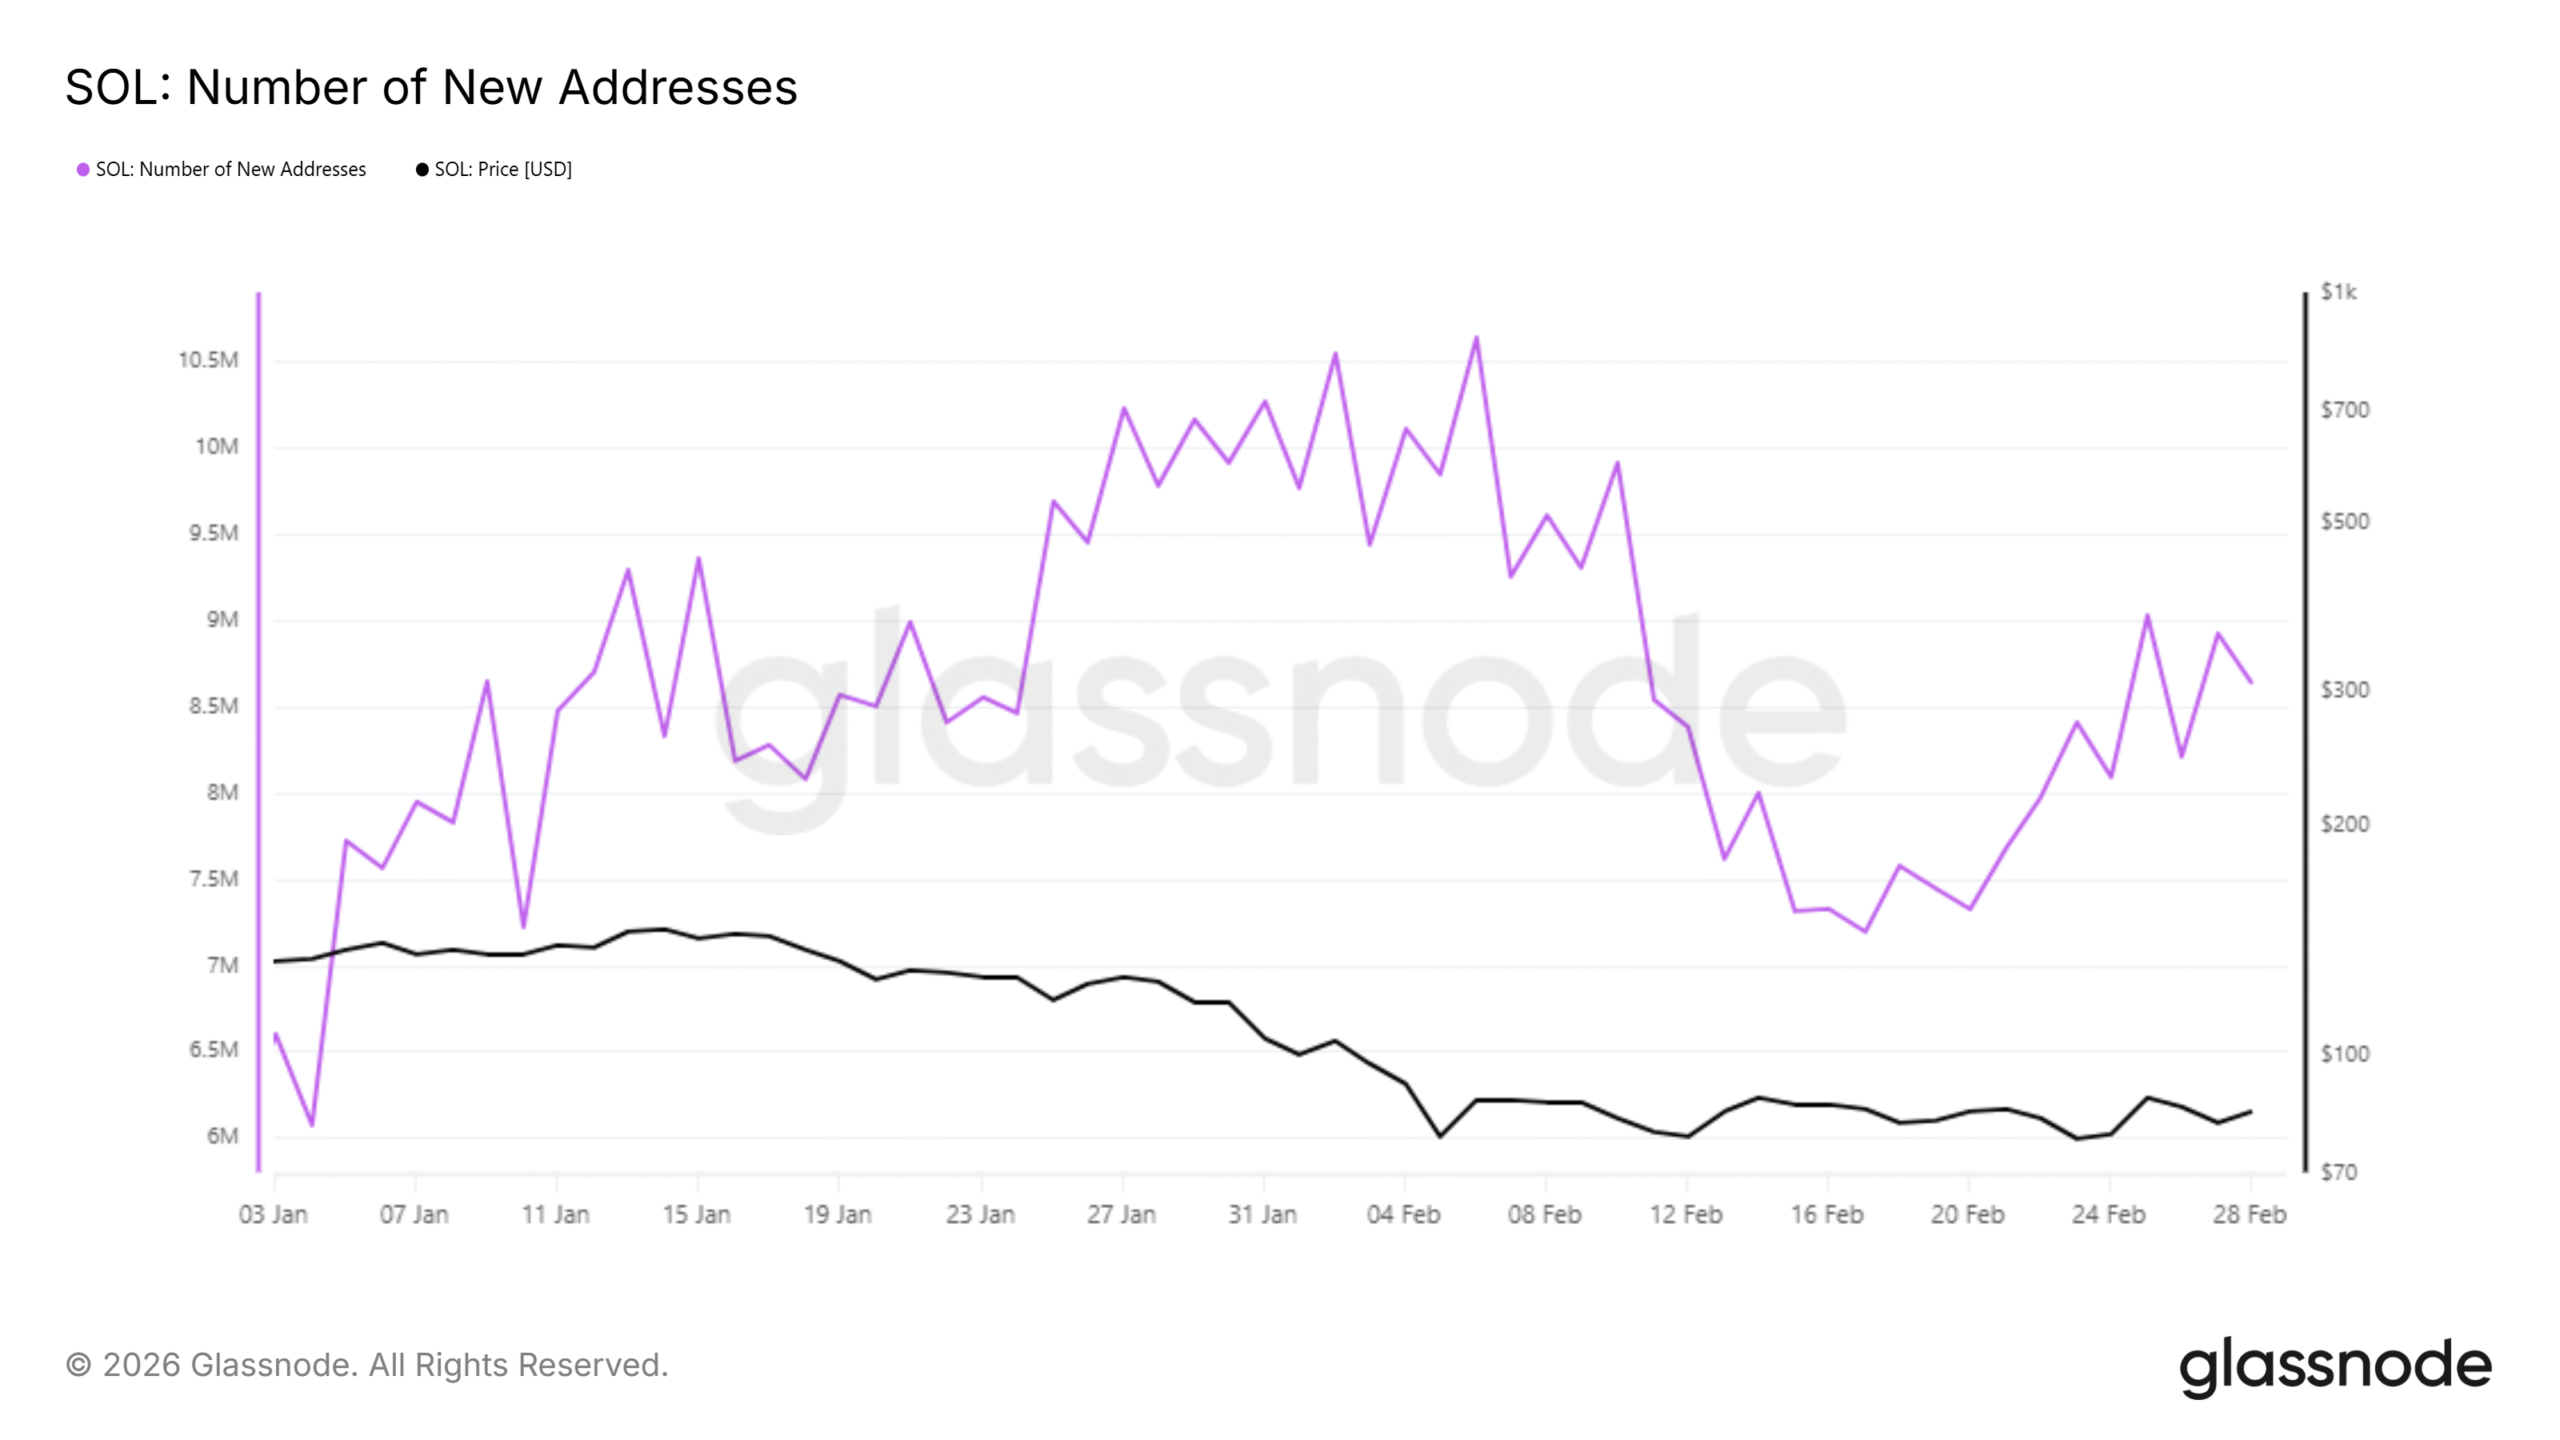
Long-term token holders maintain positive net positions, although the rate of accumulation has moderated. Data tracking hodler net position changes demonstrates sustained commitment but reflects decreased buying intensity.
Should SOL breach the $88 level and subsequently overcome $93.43, the immediate target becomes the 50-day EMA near $99. A confirmed close above that threshold would establish a pathway toward $137.
Conversely, if price action breaks down through $77, the next meaningful support zone lies at $67.50, established during the February 6 decline.
SOL’s 24-hour trading volume decreased 5.77% to $12.20 billion, while Open Interest contracted 3.73% to $4.88 billion according to the most recent market data.