
 Compressed at Triangle Apex — Breakout or Breakdown Imminent?")
Key Takeaways
- SOL is currently priced at $84.63, trapped within a compressed CRT boundary spanning $84.43 to $85.05.
- Technical analyst Ali Charts identified a descending triangle formation reaching its apex, suggesting a potential 10% swing to either $93 or $76.
- Overhead resistance at the $86–$88 level continues to reject upward attempts, with multiple failed reclaim efforts.
- Solana’s development teams have finalized Falcon quantum-resistant signature implementation, ready for deployment without network degradation.
- ETF interest remains muted while social engagement metrics trend downward, suggesting prolonged sideways action.
Solana finds itself at a critical juncture. After days of tightening price compression, technical indicators point toward an imminent significant movement — though the ultimate direction remains uncertain.
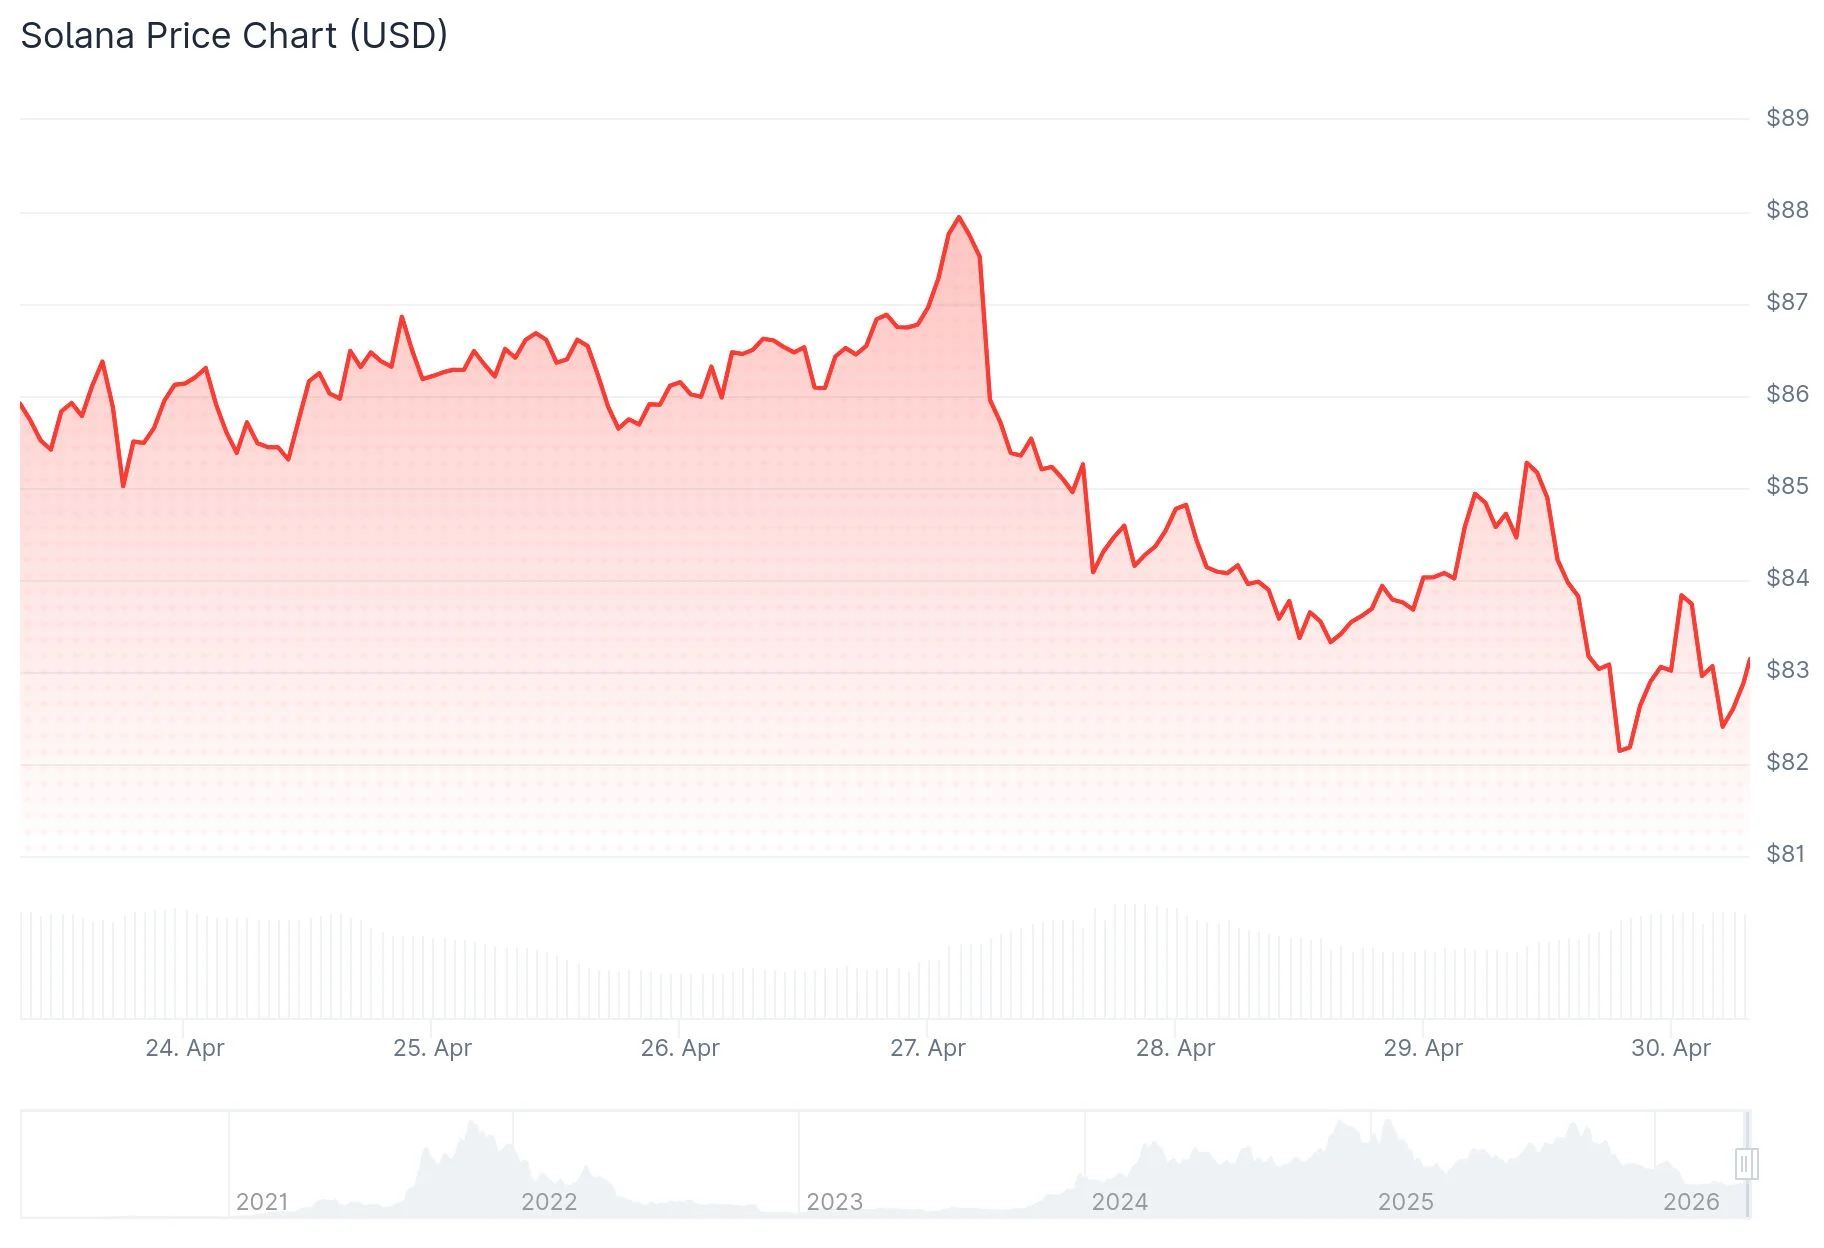
As of April 29, SOL is changing hands at $84.63. The cryptocurrency remains confined within a restricted trading band, with the current candle’s upper limit at $85.05 and lower boundary at $84.43. The SAR support level rests at $84.27, while the 20-day EMA at $84.24 provides additional underpinning just beneath.
A remarkable convergence is occurring with four key moving averages — including the 50-day, 100-day, and 200-day EMAs — clustered within a mere 1.2-point span directly above the current trading level. This type of technical compression historically precedes rapid directional moves.
Technical Analysis Reveals Critical Formation
Crypto analyst Ali Charts highlighted this week that SOL has reached the convergence point of a descending triangle pattern visible on hourly timeframes. The pattern’s upper trendline has been gradually declining from the $92 level, while the lower support has been climbing from the April 18 bottom near $82. Price action has been methodically contracting between these boundaries since that time.
When triangles reach their apex, they exhaust consolidation room and typically resolve through sharp directional moves. According to Ali Charts’ analysis, the pattern projects a 10% magnitude move, establishing upside targets near $93 or downside objectives around $76 should support fail. The current CRT configuration favors bullish resolution, with the SAR level and EMA grouping providing immediate support.
The resistance zone between $86 and $88 continues to function as a formidable barrier. SOL has repeatedly attempted to breach this area without success, while both RSI and MACD indicators display weakening momentum characteristics. A definitive daily close above $85.05 would represent the initial confirmation needed to challenge that resistance cluster again.
A more concerning scenario involves the channel’s lower boundary. Should the $80 support level give way, technical analysts anticipate rapid declines targeting the mid-$70s range. Currently, the highest probability outcome appears to be continued lateral movement between $81 and $87 as the consolidation pattern matures.
Quantum-Resistant Infrastructure Deployment Ready
Beyond chart patterns, the Solana Foundation released a comprehensive quantum preparedness assessment this week. Both Anza and Firedancer — the two primary teams managing Solana’s core protocol development — have successfully integrated testing versions of Falcon, the NIST-approved post-quantum cryptographic signature algorithm that Algorand currently operates in live production environments.
The Falcon implementation can be activated immediately if quantum computing threats escalate, without requiring disruptive network-wide upgrades. The technical integration maintains Solana’s characteristic high transaction throughput and low latency performance.
This announcement followed two significant April developments. The Drift protocol experienced a $280 million security breach attributed to a sophisticated six-month campaign by North Korean-affiliated threat actors. Additionally, the Solana Foundation introduced STRIDE, a comprehensive security assessment initiative providing continuous threat monitoring for DeFi applications managing over $10 million in total value locked.
In derivatives markets, futures trading volume declined 16.39% to $7.45 billion while open interest remained stable at $5.02 billion. The long-to-short ratio stands at 1.0076, with leading traders on both Binance and OKX maintaining long positions above the 2.64 threshold.
Throughout the last 24-hour period, long position holders experienced $3.70 million in forced liquidations compared to $1.38 million for short positions. Current open interest at $5.09 billion remains substantially below the late 2025 peak approaching $16 billion.