
 Holds Critical Support as 28 Billion Tokens Change Hands at $0.074")
Key Highlights
- Approximately 28 billion DOGE tokens changed hands at the $0.074 price point, establishing it as a critical support zone
- Technical analyst Kamran Asghar projects a potential rally to $0.1150 if the support level remains intact
- DOGE maintains trading around $0.0942, recording a 1.73% increase in the last 24-hour period
- The Relative Strength Index registers 48.78, indicating balanced market conditions without directional bias
- MACD indicator displays a minor bullish signal, though overall momentum lacks conviction
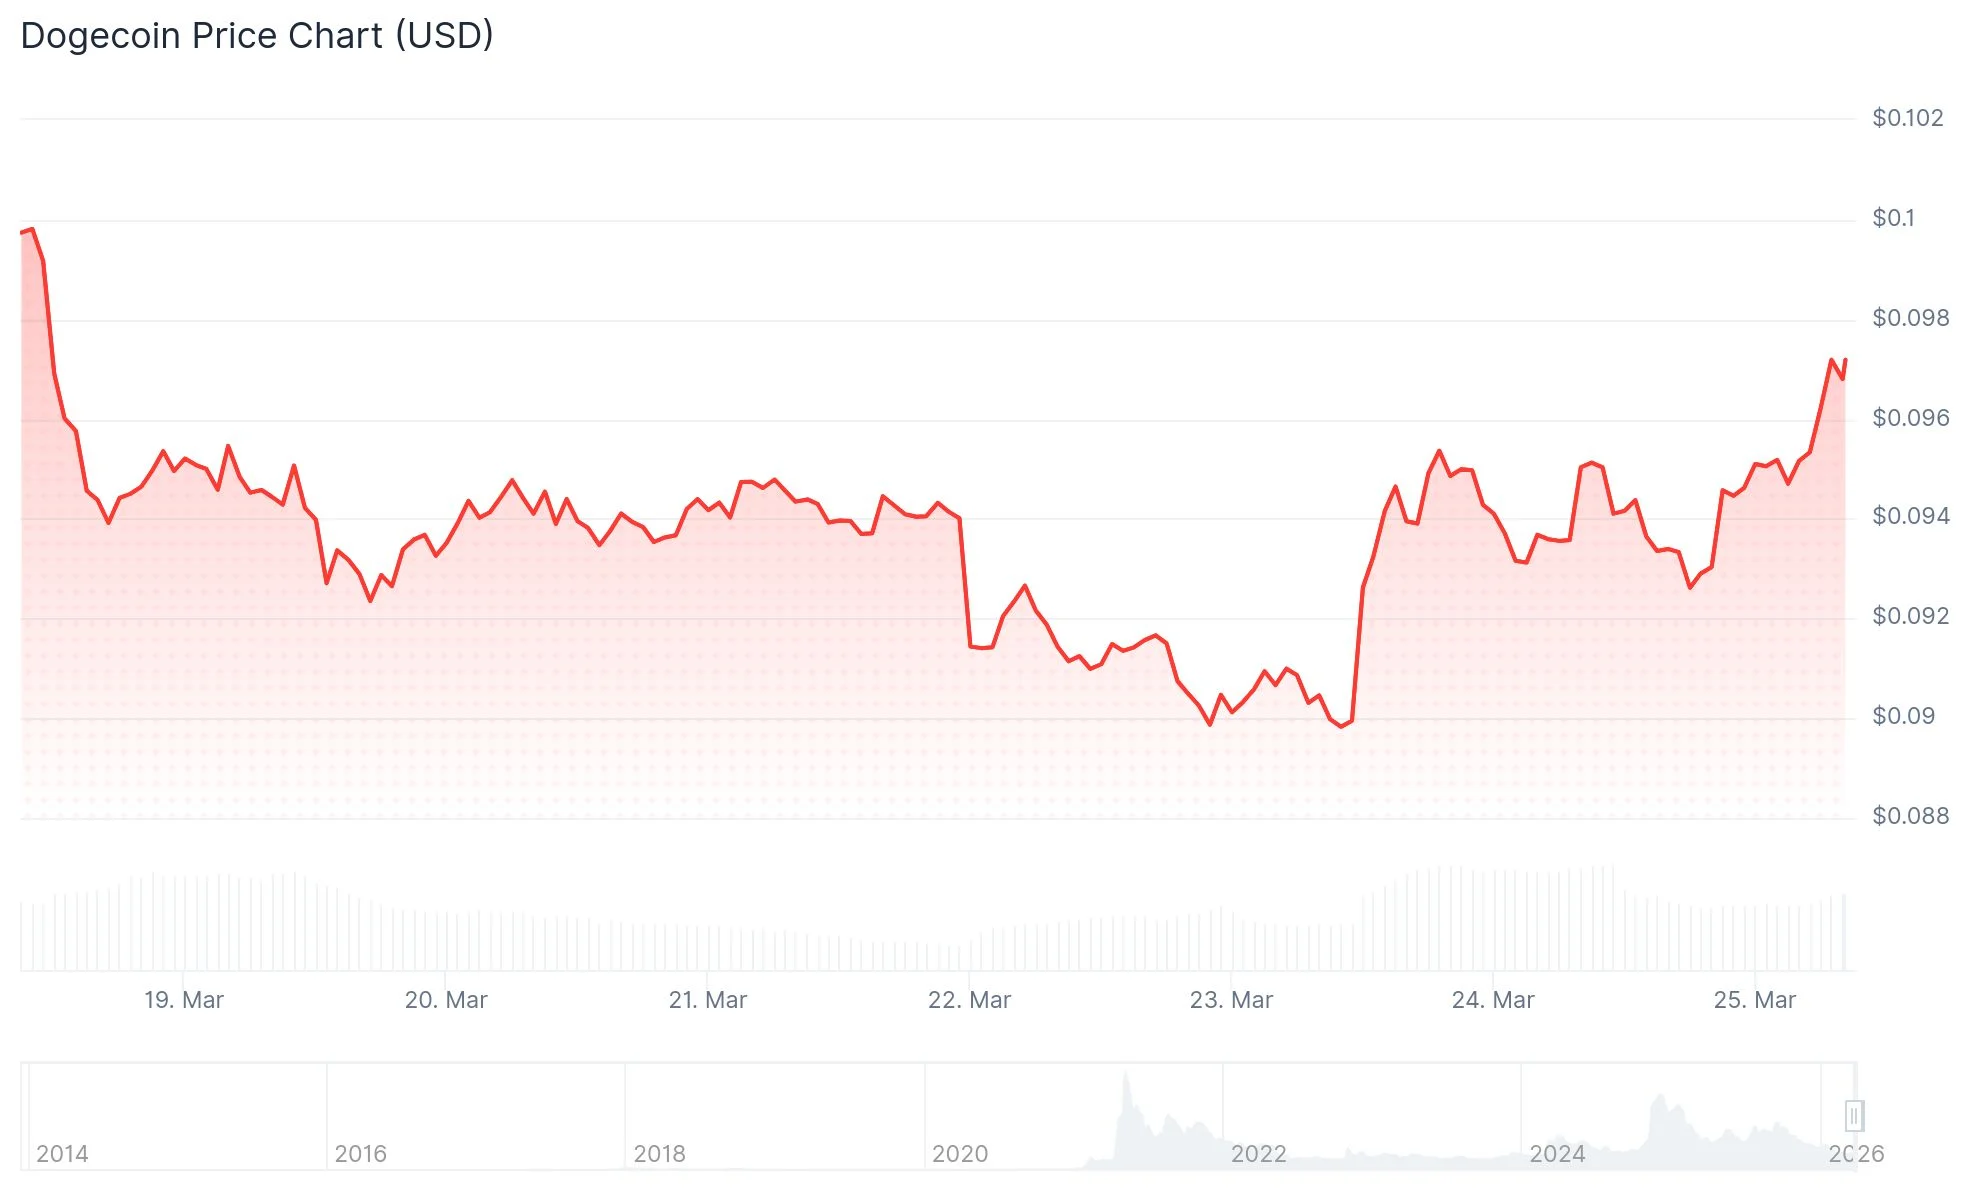
Dogecoin has established a position near the $0.0942 mark following a recovery from its intraday bottom at $0.0899. The modest 1.73% uptick in the past day reflects renewed buying interest as the price approaches the critical $0.0955 resistance threshold.
The digital asset encountered selling pressure upon reaching that ceiling, resulting in a minor pullback. Near-term support remains anchored around the $0.0930 level. Successfully clearing the $0.0955 barrier could pave the way for additional upward movement.
Market attention has centered on the $0.074 price level. Approximately 28 billion DOGE tokens were exchanged at this valuation, which technical observers interpret as significant accumulation activity and robust demand from buyers.
Crypto analyst Ali Martinez highlights that the substantial transaction volume at this threshold indicates strategic positioning by major market participants. Should the $0.074 floor prove resilient, the token could challenge resistance zones at $0.088 followed by $0.096.
Conversely, a breakdown beneath $0.074 might trigger additional downside pressure. Currently, market participants continue defending this crucial area.
Expert Technical Perspectives
Cryptocurrency analyst Kamran Asghar identifies DOGE as currently testing a support threshold that has historically preceded price recoveries. His technical projection anticipates a move toward $0.1150 should buying pressure materialize at current levels.
Asghar emphasizes this zone’s historical significance as a launching point during previous market cycles. According to his assessment, trading volume and market sentiment will be decisive factors determining the next directional move.
Technical analyst Ali Charts observes that DOGE is forming a consolidation pattern within a descending triangle formation. His analysis suggests a potential 29% price movement may develop, although the breakout direction remains unconfirmed.
Market observer CW on X identifies the $0.085–$0.09 range as a historically significant bottom formation area. His research demonstrates that previous rebounds from this zone have consistently generated substantial upward momentum.
The pattern of progressively higher lows within an ascending channel structure remains unbroken. According to CW’s analysis, maintaining position above present support levels preserves the bullish outlook.
Technical Indicator Analysis
The Relative Strength Index presently shows a reading of 48.78. This positions DOGE in neutral market territory, reflecting equilibrium between buying and selling forces.
Current price behavior shows no signs of approaching extreme overbought or oversold conditions. The market structure suggests a consolidation pattern is developing after recent volatility.
The MACD technical indicator reveals a modest bullish intersection, with the signal line positioned marginally above its counterpart. The histogram remains compressed near the zero baseline, reflecting subdued momentum conditions.
While a tentative recovery attempt is visible, no significant divergence has emerged to confirm an imminent directional breakout.
As of March 25, 2026, DOGE maintained a trading price of $0.09419, having rebounded from the session’s lowest point at $0.0899.