
 Steady Above $2,300 Amid Whale Buying and Retail Exodus")
Key Highlights
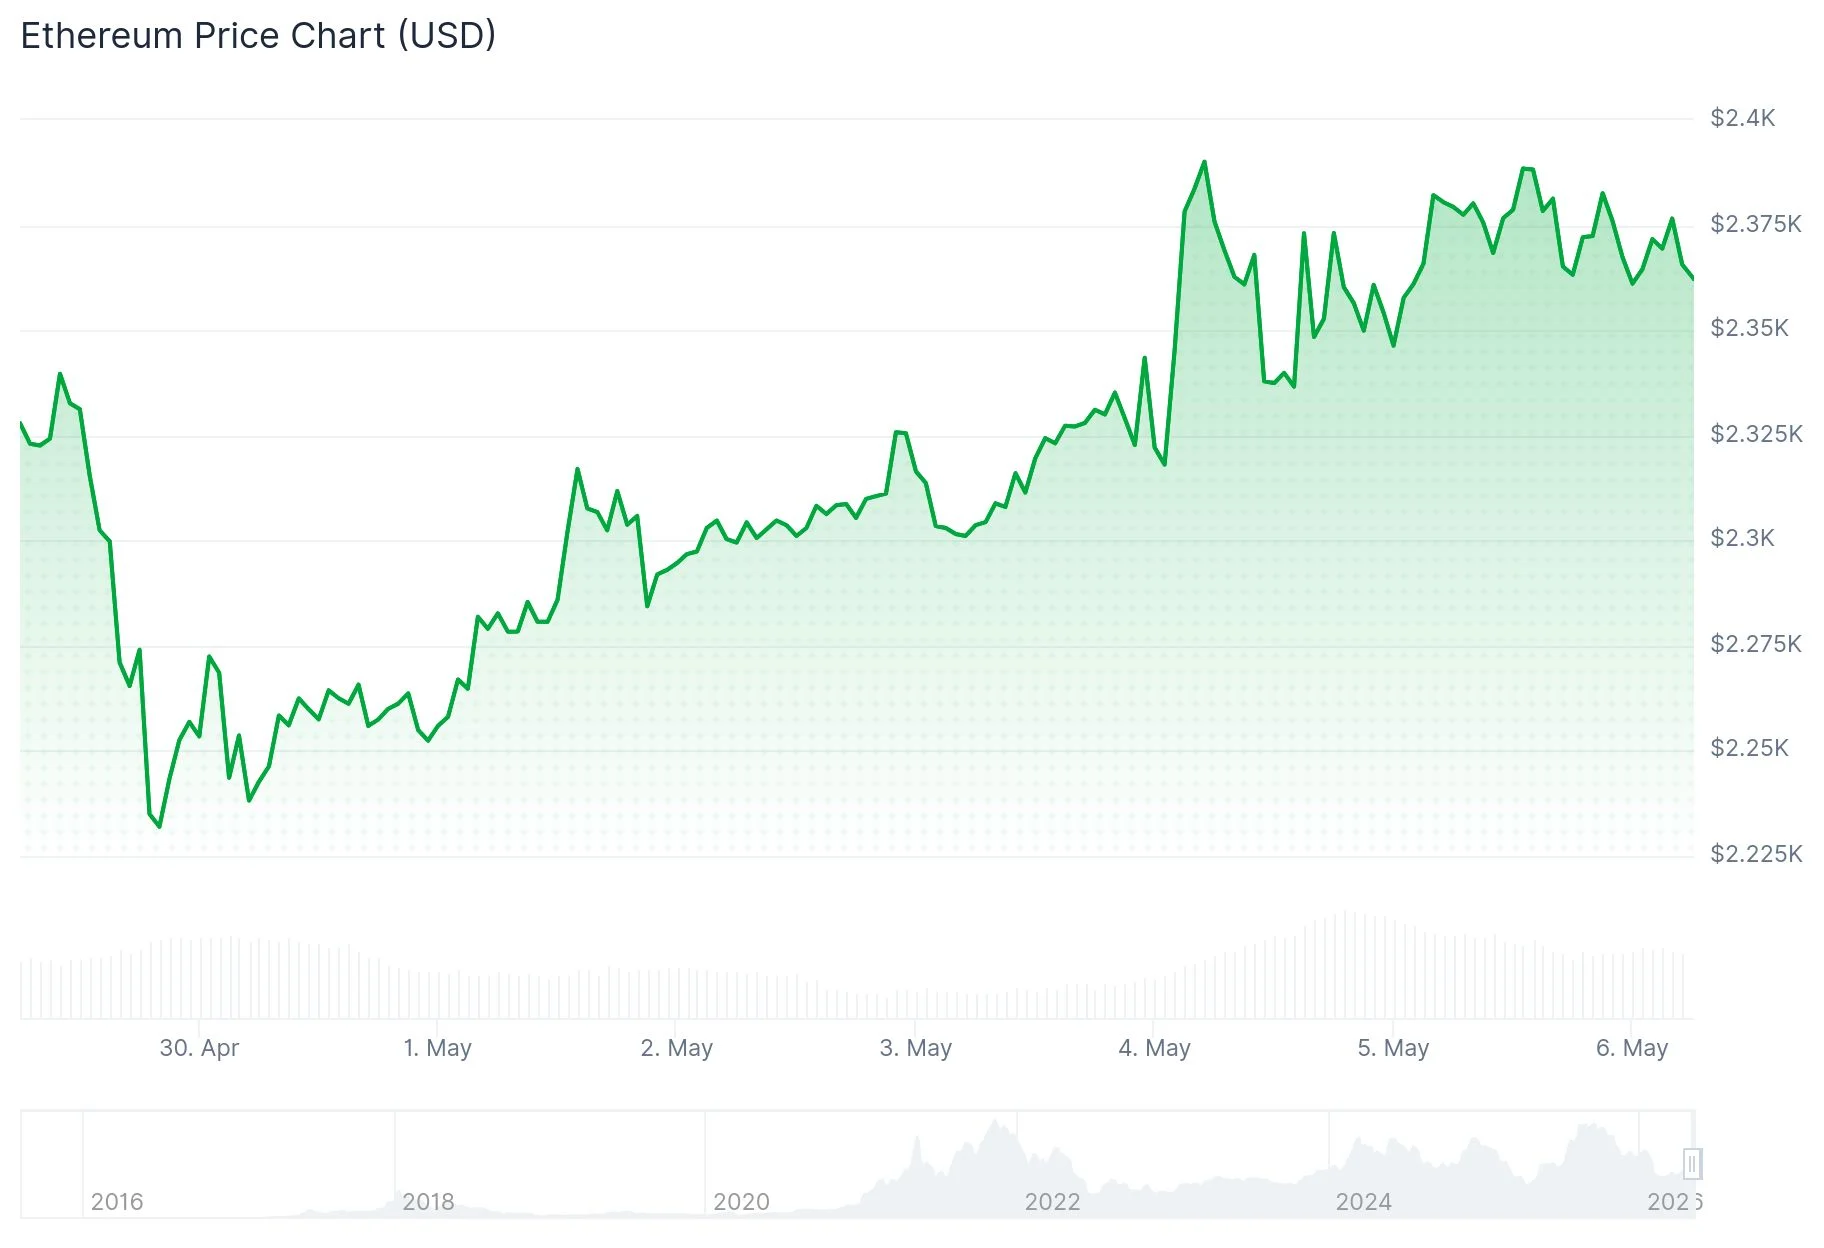
- Ethereum is currently trading in the $2,370–$2,380 range, showing a daily increase of 0.8% and weekly gains exceeding 3%
- Smaller wallets have offloaded approximately 1.5 million ETH within the last two weeks
- Large holders added 230K ETH to their positions last week, offsetting some retail pressure
- April 2026 saw exchange withdrawals drop to their lowest point in eight months
- Critical resistance zones sit at $2,388–$2,400, while the 200 SMA rests at $2,680
Ethereum maintains a position above the $2,300 threshold as of Tuesday, with current prices hovering around $2,370–$2,380. The asset has registered a 0.8% gain over 24 hours and has climbed more than 3% throughout the past seven days.
While the weekly performance appears positive, blockchain data reveals a more complex narrative playing out beneath price action.
Smaller investor wallets containing between 100 and 10,000 ETH have dumped approximately 820K ETH during the previous week. When extending the timeframe to two weeks, this group has offloaded nearly 1.5 million ETH collectively.
The 90-day Mean Coin Age indicator has experienced a notable decline, pointing toward selling activity concentrated among recent buyers rather than established long-term holders.
Staking activity further illuminates current market dynamics. Approximately 300K ETH was withdrawn from staking protocols last week — marking the highest weekly unstaking volume since November.
In derivatives markets, perpetual funding rates for ETH have remained predominantly negative throughout the past month. Although open interest has climbed above 14 million ETH, futures market sentiment continues to reflect caution.
Large Holders Accumulate While Smaller Investors Exit
As retail participants have been distributing their holdings, larger wallet addresses have pursued the opposite strategy. Whale wallets added roughly 230K ETH to their positions last week, providing a counterbalance to retail selling.

Liquidations totaling $38.7 million occurred over the past day. Short position liquidations accounted for $26.1 million of this figure, contributing to upward price momentum.
Analyst Ali Charts identified a golden cross pattern developing between the 50 and 100 simple moving averages on Ethereum’s chart, suggesting potential upward movement toward the 200 SMA located at $2,680. Conversely, analyst Ted Pillows expressed a more reserved outlook, highlighting that ETH has repeatedly failed to breach the $2,400 level and that downside risks persist until this barrier is overcome.
Exchange Outflows Decline to Eight-Month Minimum
April witnessed ETH withdrawals from exchanges decline to levels not seen since September 2024. Approximately 19.8 million ETH was pulled from exchanges throughout the month. Binance accounted for the largest portion with 7.09 million ETH, while OKX followed with 2.4 million and Coinbase Prime recorded 1.62 million.
The reduction in withdrawal activity suggests certain investors are choosing to maintain ETH on exchange platforms rather than transferring to self-custody solutions. This behavior reflects a cautious stance rather than definitive conviction in long-term accumulation strategies.
On technical charts, ETH has successfully defended the $2,200–$2,300 support area and has established a pattern of higher lows since February. The 50-week and 100-week moving averages are positioned within the $2,500–$2,800 band and currently serve as overhead resistance.
Ethereum continues testing the $2,388 resistance barrier. Price action remains confined below both the 50-week and 100-week moving averages.