
 Bulls Target $86 Resistance as ETF Inflows Signal Renewed Interest")
TLDR
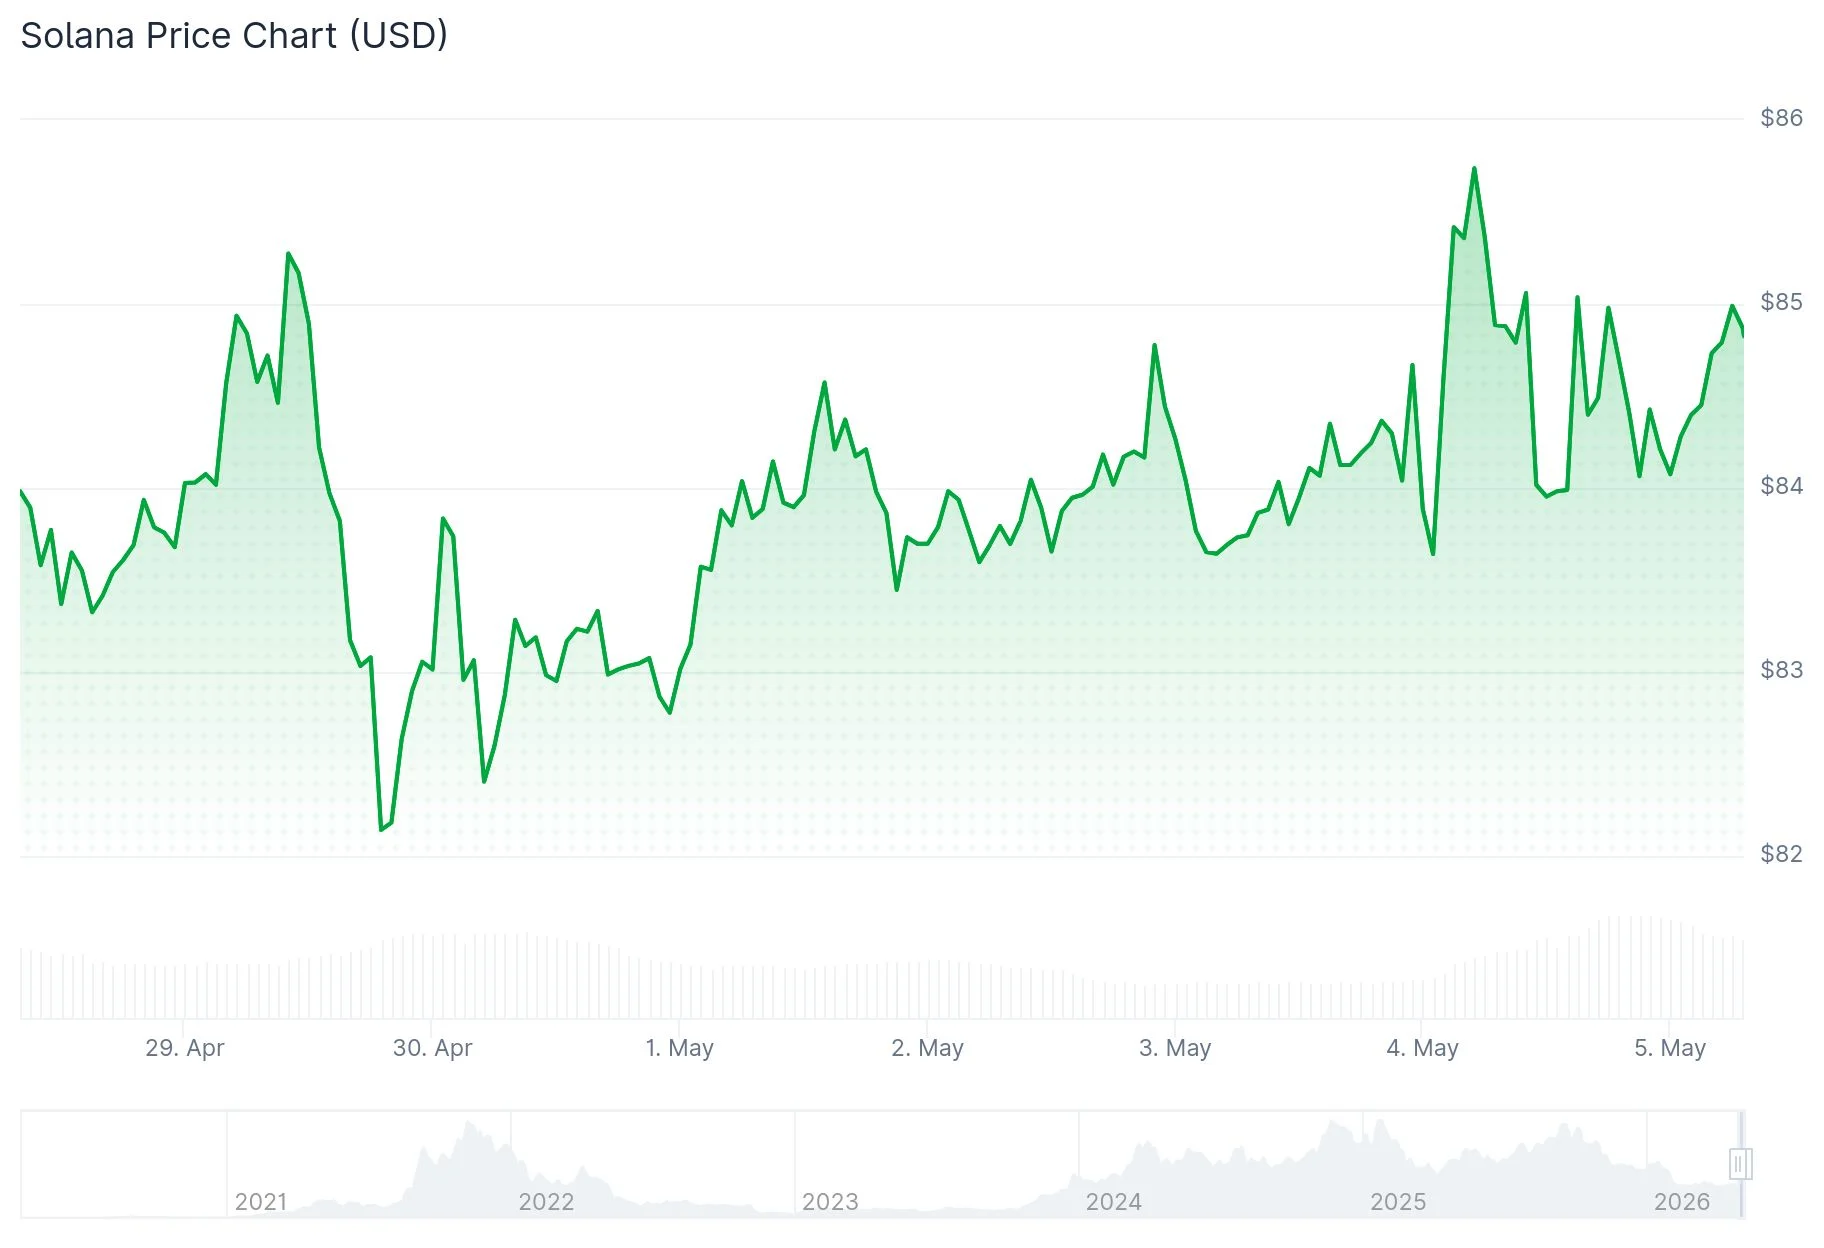
- Solana (SOL) currently trades at approximately $84.94, posting a 1.32% gain over the previous 24-hour period, maintaining a market capitalization close to $48.96 billion.
- Bulls must overcome the 50-day EMA positioned at $86.10 to initiate a potential short-term bullish reversal.
- The cryptocurrency has remained beneath the $100 threshold for 90 consecutive sessions, marking its longest sub-$100 period since 2020.
- Network payment activity on Solana exceeded $10 billion during Q1 2026, demonstrating robust blockchain utilization despite subdued price performance.
- Monday witnessed the first positive spot ETF flows since late April, with $3.28 million in capital entering the funds, hinting at renewed institutional participation.
Solana (SOL) maintains its position around the $85 mark this Tuesday as market participants monitor whether buying pressure can overcome a critical technical resistance barrier. Currently valued at roughly $84.94, the token has gained 1.32% over the last day, supporting a market capitalization of about $48.96 billion alongside trading volumes reaching $3.05 billion.
Traders are concentrating their attention on the 50-day Exponential Moving Average (EMA), currently positioned at $86.10. This technical indicator has proven difficult for SOL to surpass decisively, maintaining downward pressure on price action in the immediate term.
The $86–$88 range has consistently rejected upward price movements during recent rally attempts. Without establishing sustained support above this zone, each recovery effort faces the threat of creating another descending peak. The 23.6% Fibonacci retracement level at $86.67 sits just overhead, contributing to the concentration of resistance in this area.
Market analyst CryptoJack noted via X that SOL continues facing challenges in reclaiming the 50 EMA, while a previously supportive ascending trendline has lost strength following the price dropping beneath it. This development indicates that bulls must regain both the trendline and the 50 EMA simultaneously to reverse current momentum dynamics.
Momentum indicators present a mixed picture. The Relative Strength Index (RSI) currently hovers around the neutral 50 mark, while the MACD indicator trades marginally below zero. These readings indicate diminishing selling pressure without confirming that buyers have established definitive control.
ETF Inflows and Derivatives Data Hint at Improving Sentiment
Institutional activity provided a modest encouraging development. According to SoSoValue data, spot Solana ETFs attracted $3.28 million in fresh capital on Monday, representing the first positive flow since April 23. Sustained inflow trends throughout this week could deliver additional buying momentum.

Derivatives markets also show shifting sentiment. The long-to-short ratio for SOL on CoinGlass climbed to 1.12 on Tuesday, marking its highest level in more than 30 days. When this ratio exceeds one, it signals that more market participants have positioned for price appreciation rather than decline, indicating cautiously optimistic market positioning.
CryptoQuant analytics reveal moderating conditions in spot markets alongside buyer dominance in futures contracts, with most other metrics registering neutral territory.
On-Chain Activity Stays Strong Despite Price Weakness
Despite price struggles, Solana’s network fundamentals remain robust. Trader Symba highlighted data on X demonstrating that Solana’s blockchain processed approximately 10.1 billion transactions in payment volume during Q1 2026, crossing the $10 billion milestone.
Such elevated network engagement rarely coincides with fundamentally bearish conditions. This disconnect between substantial blockchain usage and lackluster price performance has been identified by traders and market observers as a potentially supportive element should buying interest materialize.
Solana has now accumulated 90 straight days trading below $100, representing its longest such period since 2020, as noted by analyst shah on X. The $100 level now serves as a significant psychological barrier. Successfully reclaiming this threshold would signal a breakout from an extended consolidation pattern.
Regarding downside scenarios, the $83–$84 area represents immediate support. A breakdown below this zone could trigger testing of the $80–$78 levels.
The long-to-short ratio achieving its highest reading in over a month stands as the most current indicator suggesting improving trader confidence.