
 Surges Toward $3,000 as Traders Return in Full Force")
Key Takeaways
- The ETH/BTC pair has declined approximately 5.5% in the last seven days, with a bear flag formation suggesting a potential additional 10% correction to 0.026 BTC.
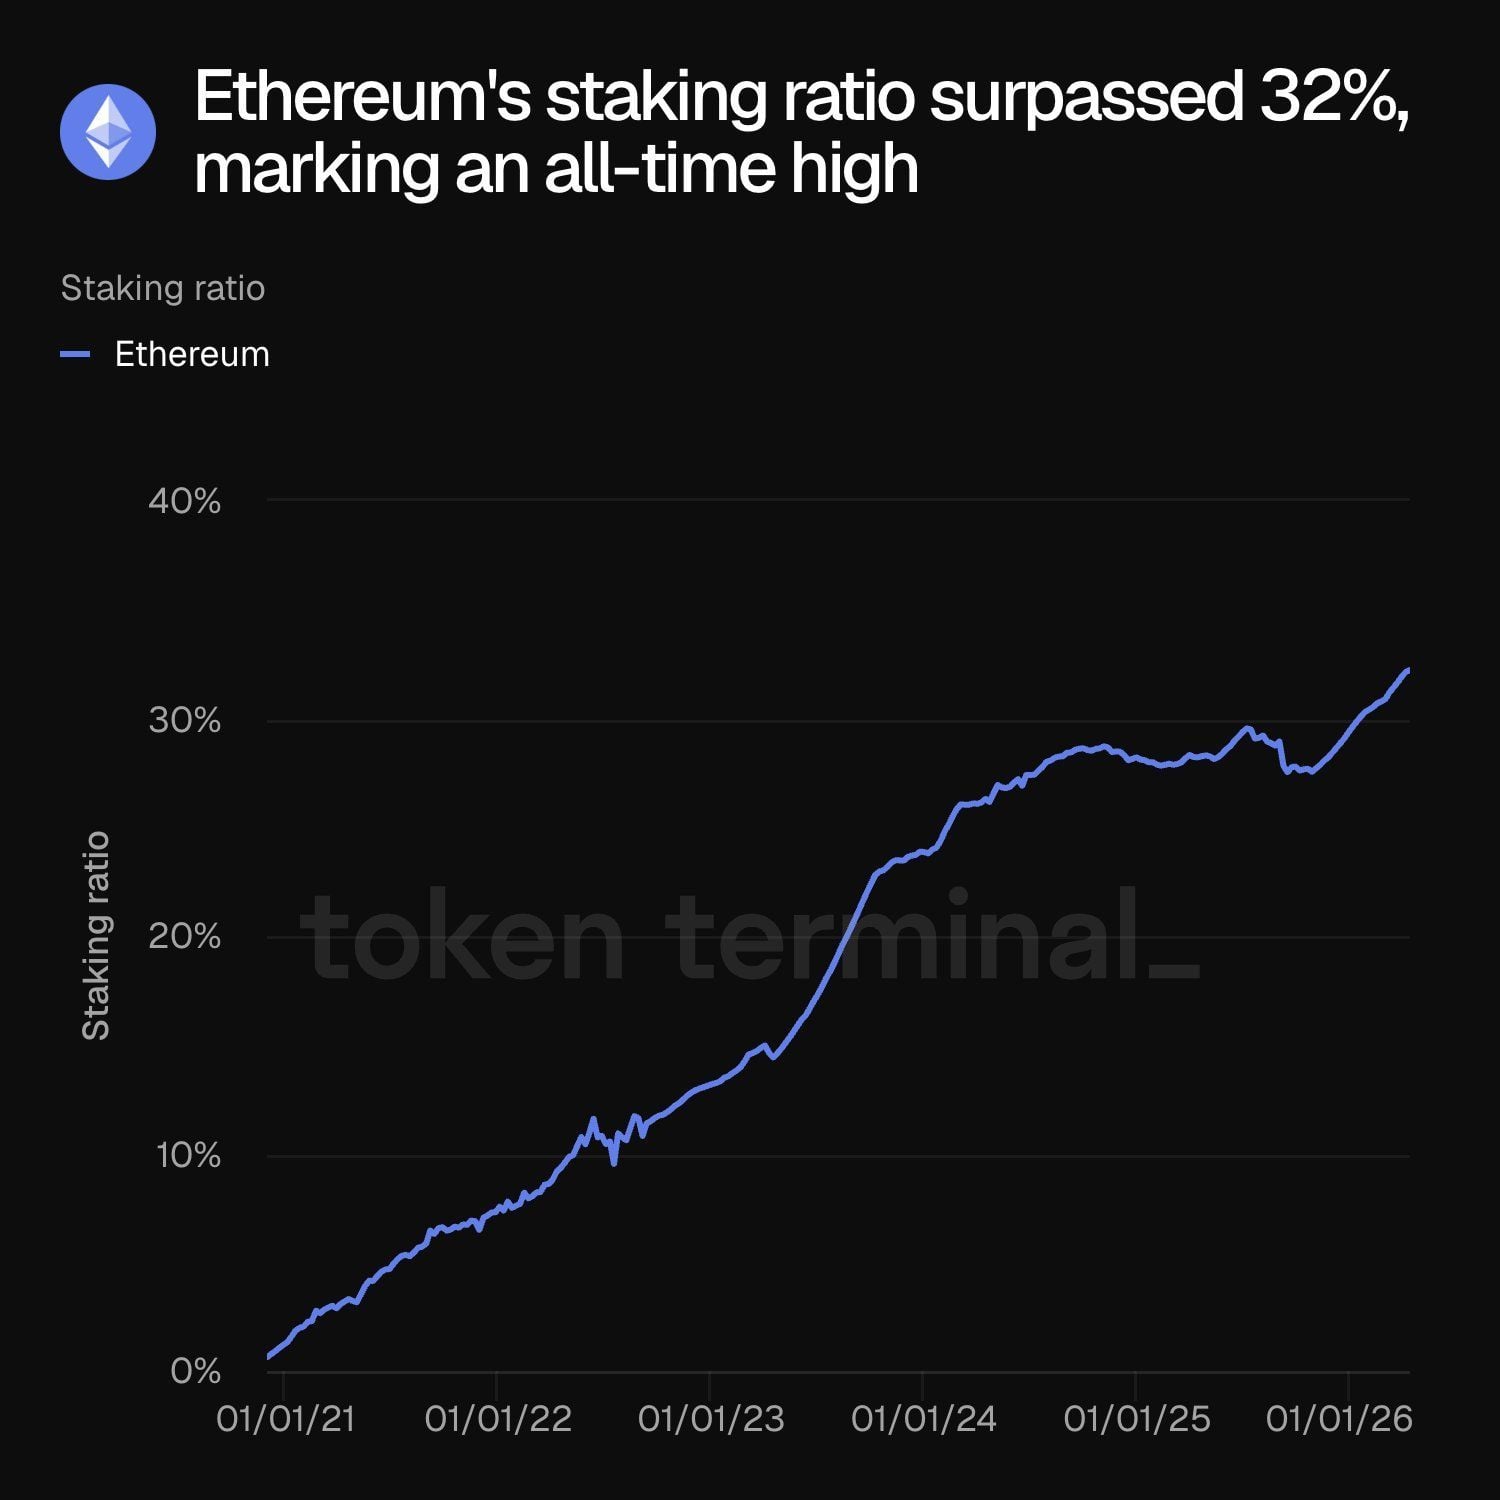
- A historic milestone was reached as Ethereum’s staking ratio climbed to 32.33%, securing roughly 39 million ETH and tightening available supply.
- Ethereum ETFs attracted almost $494 million in net inflows across eight consecutive trading sessions.
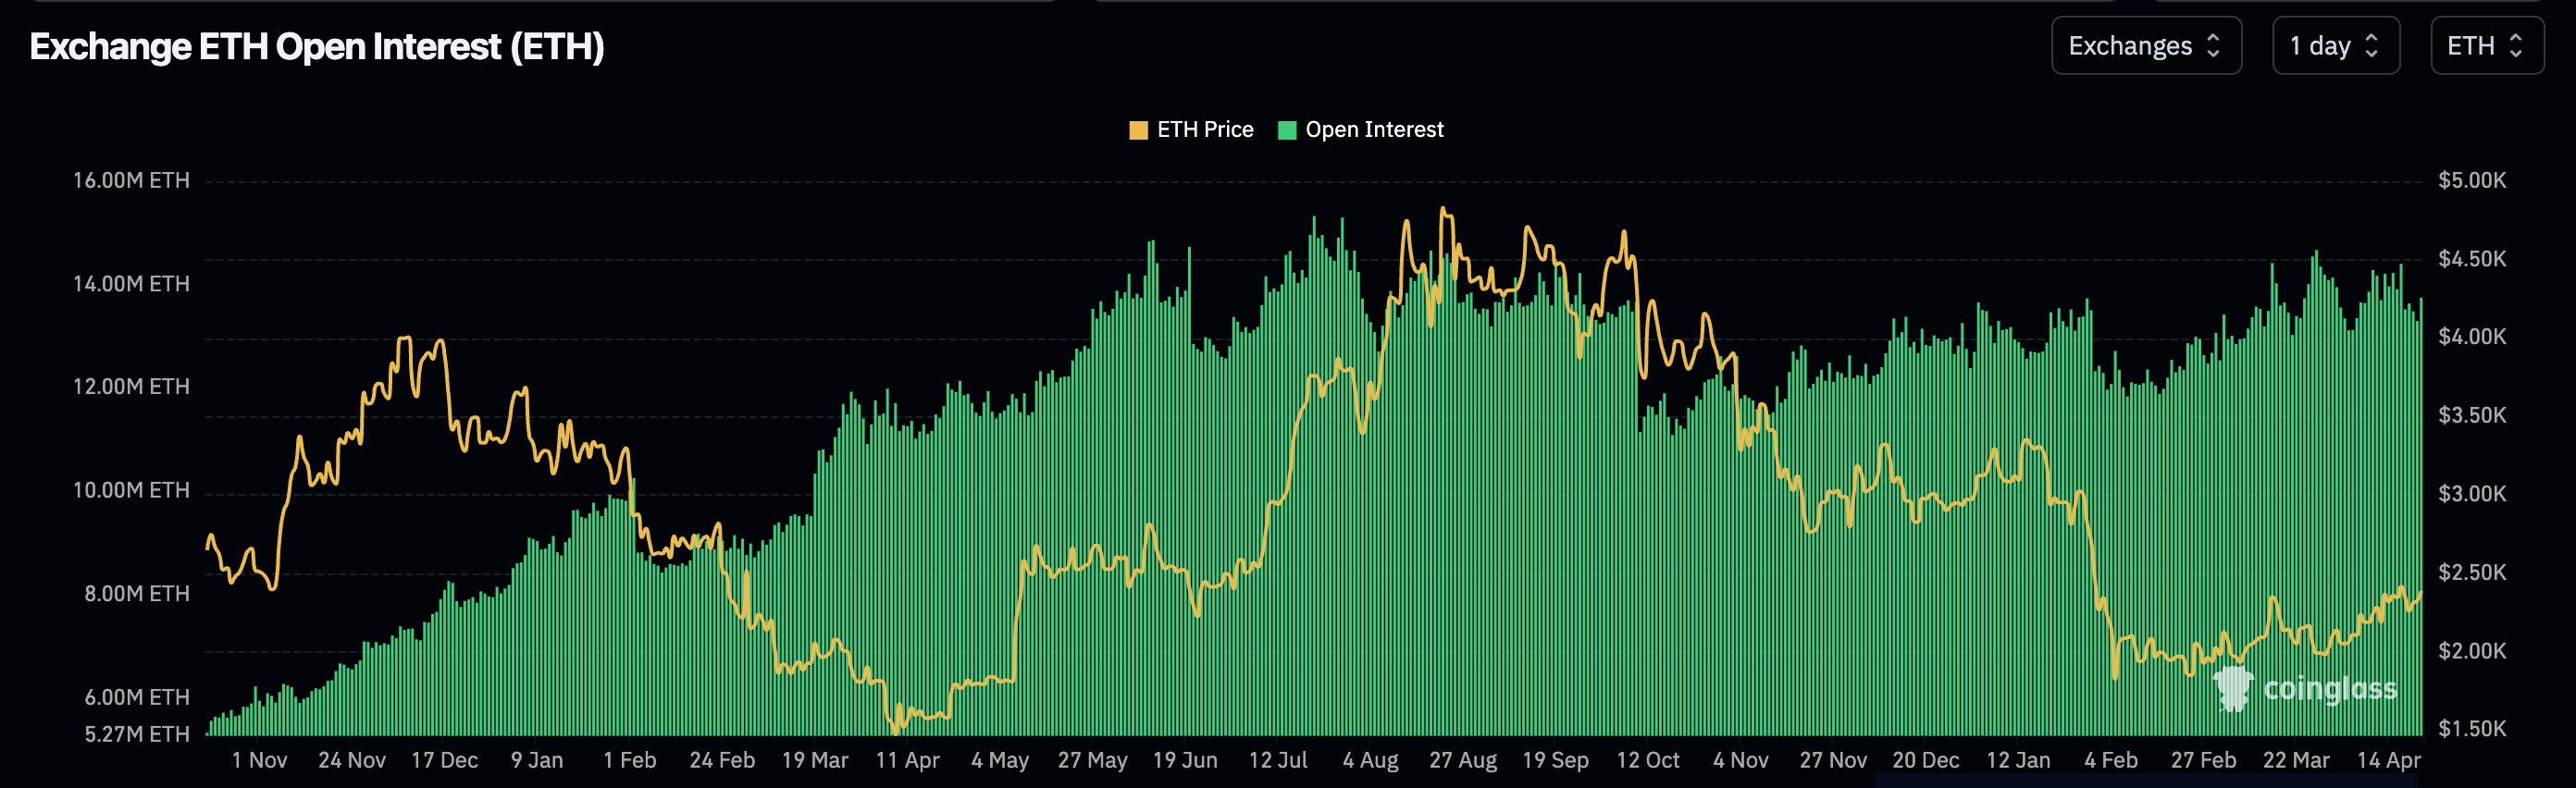
- Bullish sentiment emerged in derivatives markets — funding rates turned positive while open interest increased by 440K ETH.
- Near-term resistance targets are positioned at $2,746–$2,800, with $3,000 becoming achievable if ETH breaks through the 200-day EMA at $2,650.
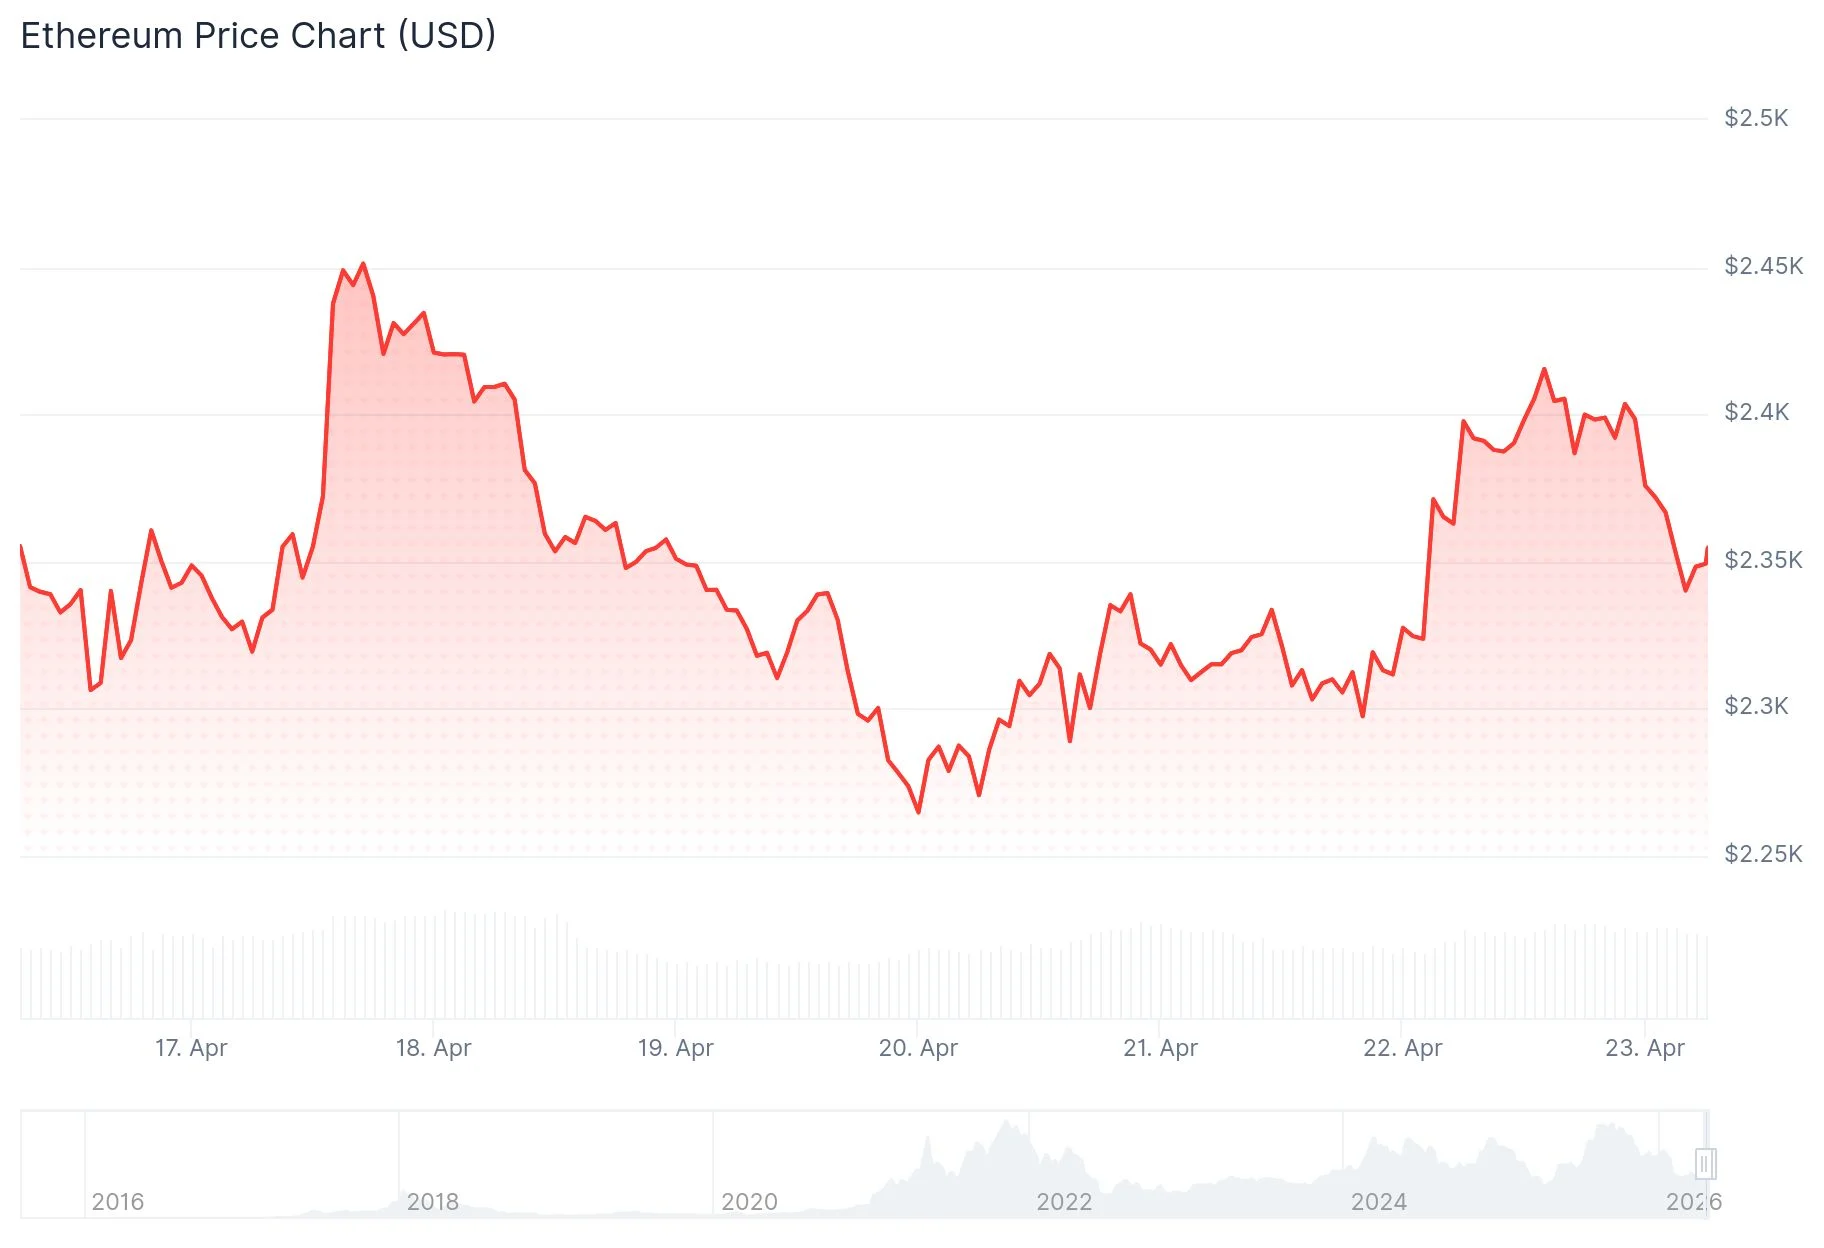
Ethereum is currently hovering around $2,400 following a 10% appreciation over the last month. While derivatives indicators are flashing bullish signals, the technical picture against Bitcoin presents a cautionary narrative. Here’s what the latest data reveals.
Funding rates for Ethereum perpetual futures contracts shifted into positive territory this week, currently standing at approximately 0.0031% at press time. This metric indicates that long positions outnumber short positions among traders. Additionally, the Taker Buy-Sell Ratio has returned to bullish levels, demonstrating that buyers are dominating order flow compared to sellers.
Open interest across ETH futures contracts expanded by 440,000 ETH within a compressed timeframe. When denominated in ETH, open interest has recovered to heights last observed in mid-2025. The all-time peak remains roughly 6% higher than present readings.
Short position liquidations have been substantial. Throughout the previous seven days, over $1.6 billion worth of short bets were eliminated. Within a single 24-hour stretch, approximately $100 million in short positions faced liquidation.
Spot Ethereum ETFs have captured nearly $494 million through eight consecutive days of positive net capital flows. Twenty-four-hour trading volumes jumped 25%, representing more than 7% of ETH’s circulating market capitalization.
Supply Constrained by Staking Surge
Ethereum achieved a landmark staking ratio of 32.33% on April 21. Approximately 39 million ETH is now secured across 816,578 validators, representing roughly $90.26 billion in value. This marks the first instance where over one-third of ETH’s circulating tokens have been committed to staking.
The Ethereum Foundation successfully fulfilled its 70,000 ETH staking objective earlier this month. BitMine Immersion Technologies controls 4.976 million ETH, with 3.334 million already deployed in staking. Reduced circulating supply typically translates to diminished selling pressure in the market.
Critical Price Zones Under Focus
On the daily timeframe, Ethereum maintains support above its 20-, 50-, and 100-day exponential moving averages, which are grouped between $2,270 and $2,350. The Relative Strength Index rests at 60, a level technical analysts commonly interpret as bullish momentum.
A decisive move above $2,466 would validate an ascending triangle formation. Such a breakout projects upside objectives at $2,746, followed by $2,831.
The 200-day EMA is positioned at $2,650. Market analysts anticipate heightened resistance and potential profit-taking at this threshold. Successfully clearing this barrier would establish a pathway toward the $3,000 psychological level.
The scenario against Bitcoin tells a contrasting story. The ETH/BTC ratio has been developing a bear flag pattern since February. The technical projection from this formation points to 0.026 BTC — representing roughly 10% downside from current levels — with a possible timeline extending into May.
Immediate downside support is located at $2,388, followed by $2,352. More significant support zones exist at $2,211 and $2,107.