
 Surges Past $79K as Geopolitical Optimism Fuels Crypto Rally")
Key Takeaways
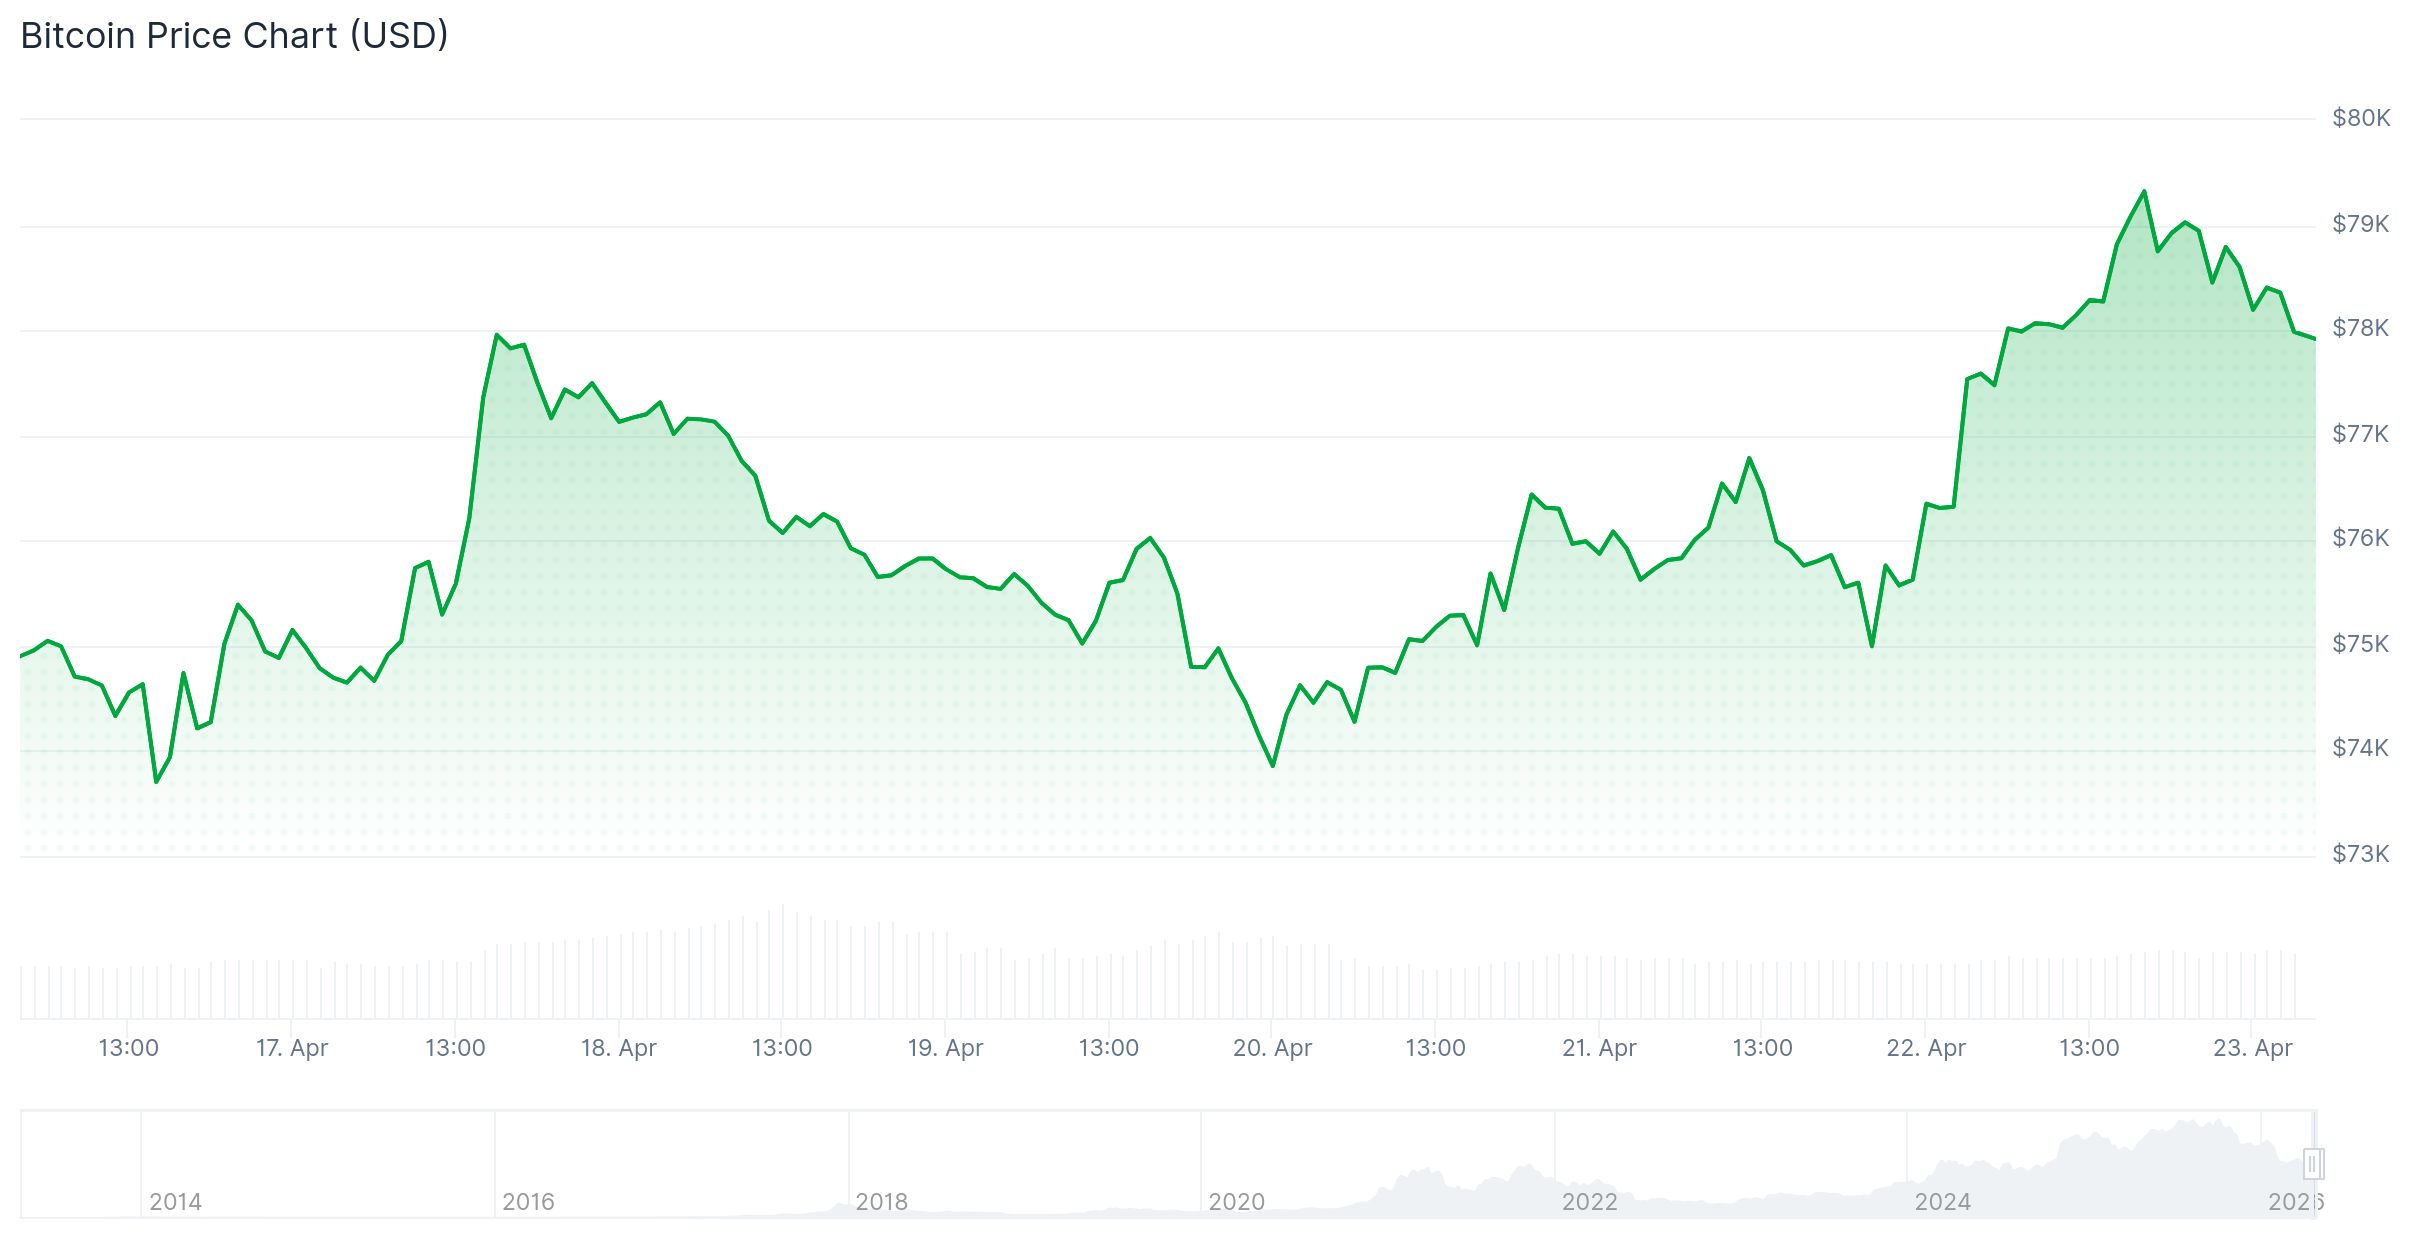
- BTC surged to $79,472 on Wednesday, marking its strongest monthly performance in 28 days since April 2025
- The positioning index for Bitcoin jumped from -10.9 in February to 4.5, indicating a shift toward bullish sentiment
- Total open interest increased 6.7% within a single day to reach 260,000 BTC, while futures OI climbed nearly 9% to $62 billion
- President Trump’s remarks about potential US-Iran diplomatic discussions provided a catalyst for risk asset gains
- Critical resistance zones are positioned at $83,000–$88,000, while support remains anchored at $72,000–$75,000
Bitcoin climbed to a monthly peak of $79,472 during Wednesday’s trading session, representing its most impressive 28-day gain since April 2025. The leading cryptocurrency posted gains exceeding 4% across a 24-hour period, approaching the psychologically significant $80,000 threshold as both on-chain indicators and derivatives market signals shifted positively.
Cryptocurrency analyst Axel Adler Jr. highlighted that Bitcoin’s positioning index climbed to 4.5, a substantial improvement from the -10.9 reading recorded in February. This composite metric incorporates net taker flow data, open interest momentum, funding rate dynamics, and exchange balance movements into a unified measurement.
Total open interest expanded by 6.7% during the 24-hour window, reaching 260,000 BTC. The rolling 30-day change in open interest currently shows a +14.5% increase, with positive closes registered in 23 of the previous 30 trading sessions.
Futures market open interest for BTC experienced a dramatic surge of nearly 9%, climbing above the $62 billion threshold. The Chicago Mercantile Exchange registered a 0.50% increase in open interest, while Binance saw approximately 2% growth following President Trump’s diplomatic commentary.
According to reporting from the New York Post, President Donald Trump indicated that peace negotiations between the United States and Iran could potentially commence as early as Friday. This announcement followed his executive decision to extend the existing ceasefire arrangement with Iran without a defined endpoint.
Equity markets in the United States also posted gains of approximately 1% on Wednesday, with the S&P 500, Nasdaq 100, and Dow Jones Industrial Average all finishing in positive territory. The broader risk asset complex demonstrated positive momentum in response to the diplomatic developments.
Tehran has not yet officially confirmed its intention to participate in the proposed negotiations. Complicating the diplomatic picture, Iranian military forces detained two commercial cargo vessels in proximity to the Strait of Hormuz just hours following the ceasefire extension announcement, introducing additional geopolitical uncertainty.
Critical Price Zones for Traders
Bitcoin has successfully broken through a descending trendline pattern that originated from its October 2025 apex near $126,000 and has recaptured the 100-day exponential moving average. The immediate testing ground sits at $81,000, where technical analysis suggests a fair-value gap indicating potential liquidity imbalances.
The $83,000–$85,000 corridor represents a zone where short-term holders historically take profits. Beyond this level, the $88,000–$91,000 region constitutes a major supply concentration where substantial trading volumes previously occurred.
The realized price metric for holders in the three-to-six-month cohort is currently positioned at $91,600, strengthening the significance of this range as a critical inflection point for market direction.
Market analyst Ali Charts highlighted Bitcoin’s formation of a Morning Star candlestick configuration on the monthly timeframe — a three-candle pattern he characterizes as evidence that selling pressure has been exhausted and accumulation is gaining momentum. He observed that historical precedent suggests an approximate 8% retracement typically occurs before the primary upward movement initiates.
Downside Protection and Risk Levels
Technical analyst Crazzyblockk pinpointed the $72,000–$75,000 range as a robust support foundation, reinforced by realized price concentrations from intermediate-term holders. A decisive breakdown below this zone could trigger additional supply moving into unrealized loss positions.
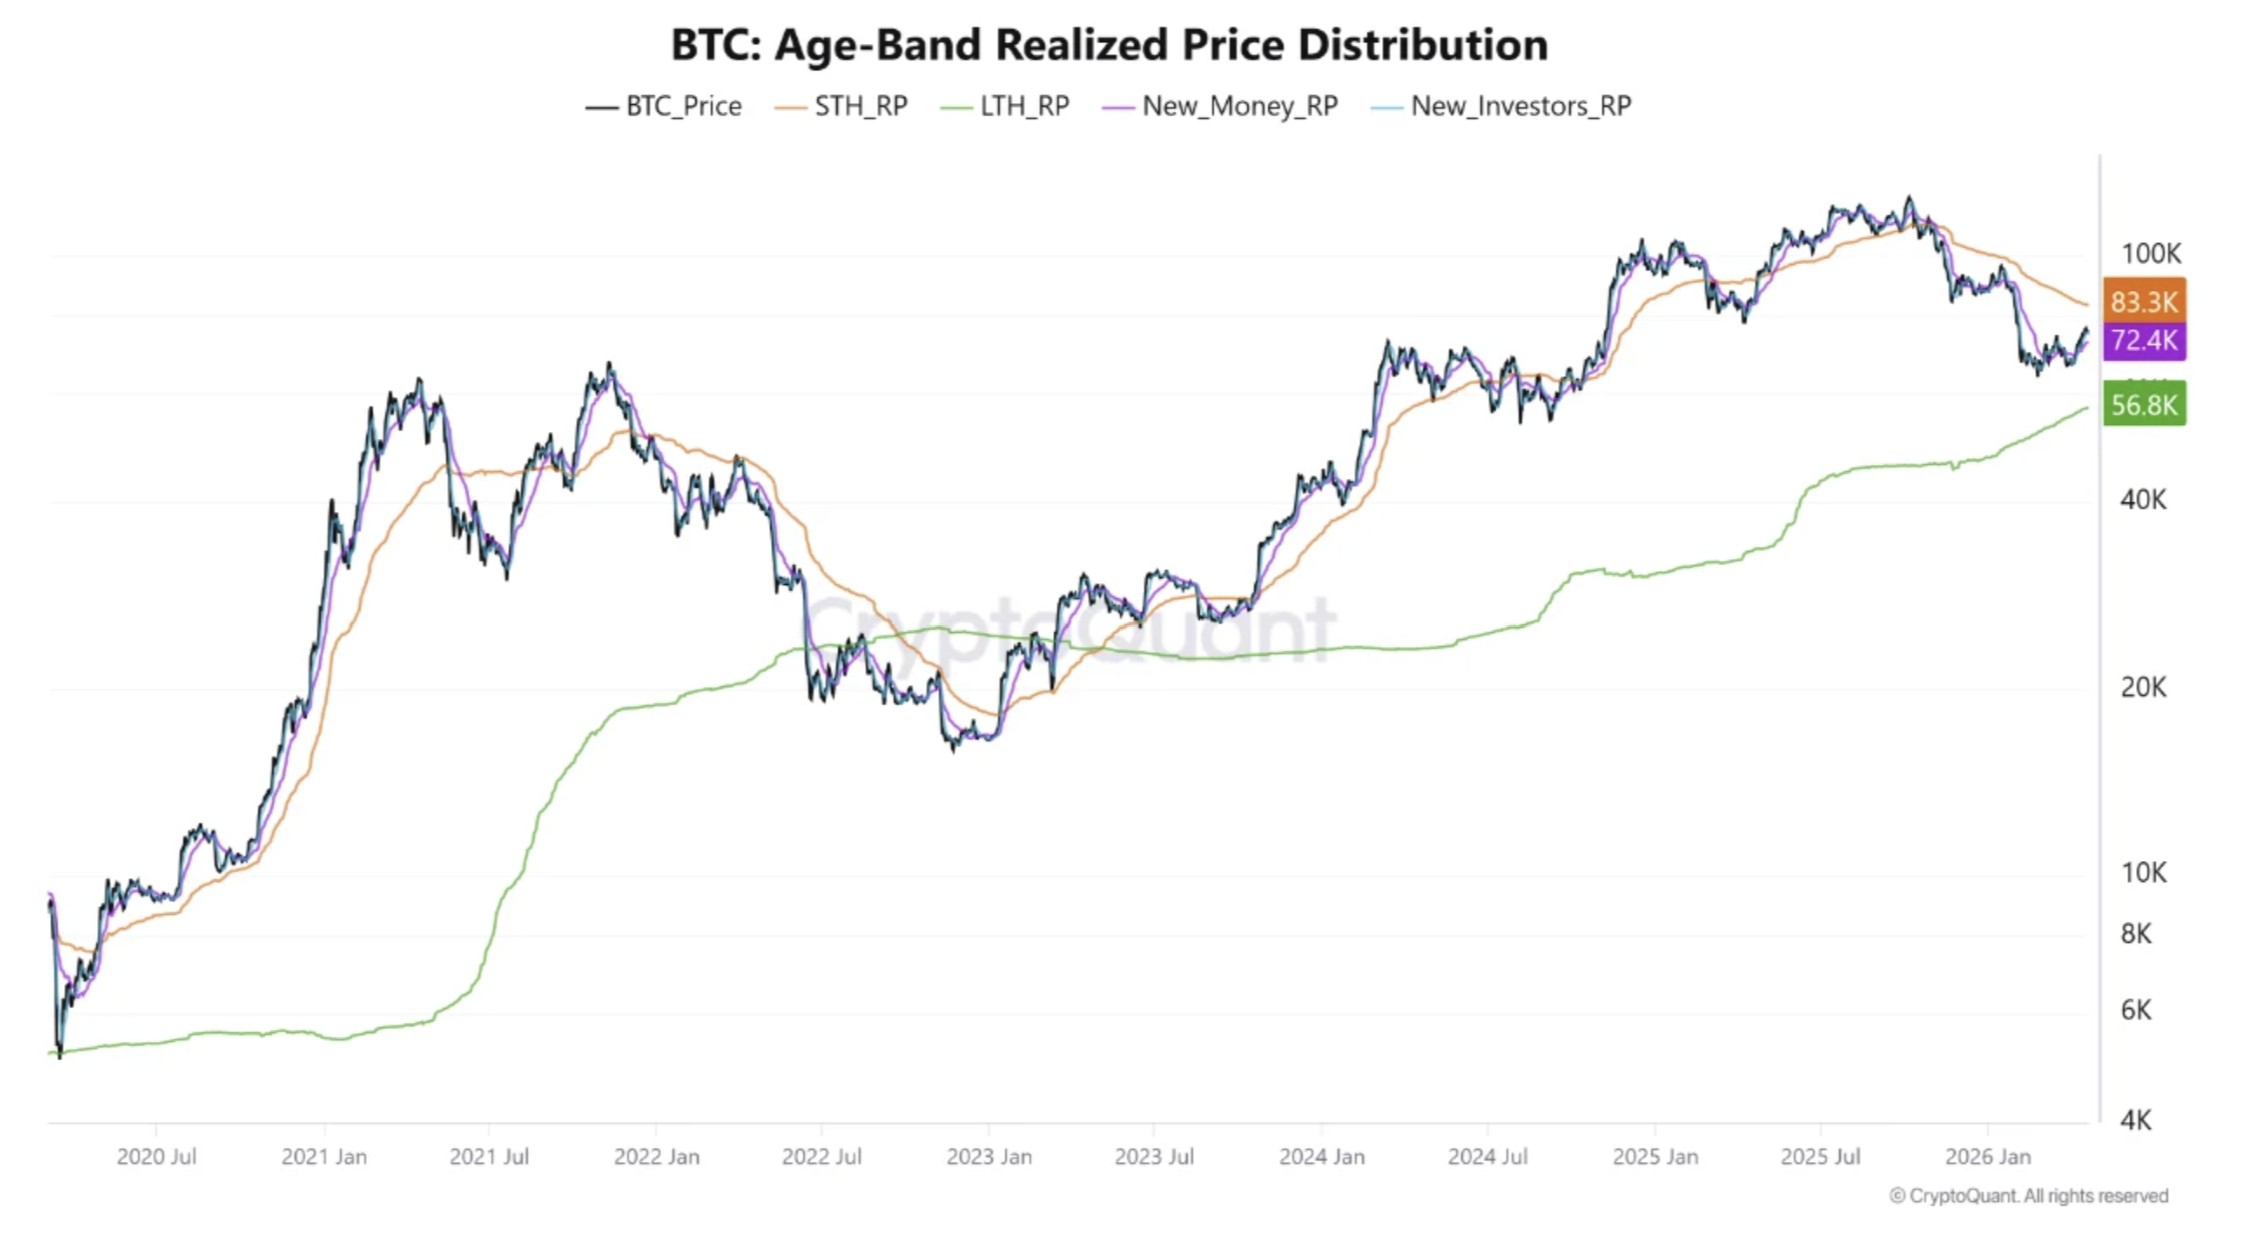
Grayscale Research had previously indicated that Bitcoin most likely established its cycle bottom within the $65,000–$70,000 band. The Bitcoin Bull Index transitioned to neutral status for the first time in half a year, according to Julio Moreno, head of research at CryptoQuant.
Trading volume contracted by 32% throughout the recovery movement, suggesting measured caution persists among market participants despite the upward price action.
Open interest in BTC futures across both CME and Binance platforms maintained upward momentum as of Wednesday afternoon, demonstrating continued active positioning within derivatives trading venues.