

Key Takeaways
- Ripple is currently hovering between $1.40 and $1.41, confined within a narrow band between $1.35 support and $1.50 resistance levels.
- Daily capital inflows into XRP investment vehicles reached $13.74 million, bringing total net inflows to an impressive $1.27 billion.
- The 30-day Realized Volatility Index has plunged to 0.42, marking the lowest reading in multiple years—a condition often followed by substantial price action.
- The token remains positioned beneath its 50-day, 100-day, and 200-day moving averages, which continue to slope downward.
- Technical analyst Ali Charts identified a symmetrical triangle formation suggesting an impending 35% price movement.
Ripple has maintained a position around the $1.40 to $1.41 range, locked in a constrained trading zone that has left market participants on both sides waiting for clarity. Over the last week, the digital asset has climbed approximately 8%, benefiting from renewed optimism across cryptocurrency markets. However, it continues to struggle with breaking through the critical $1.50 threshold.
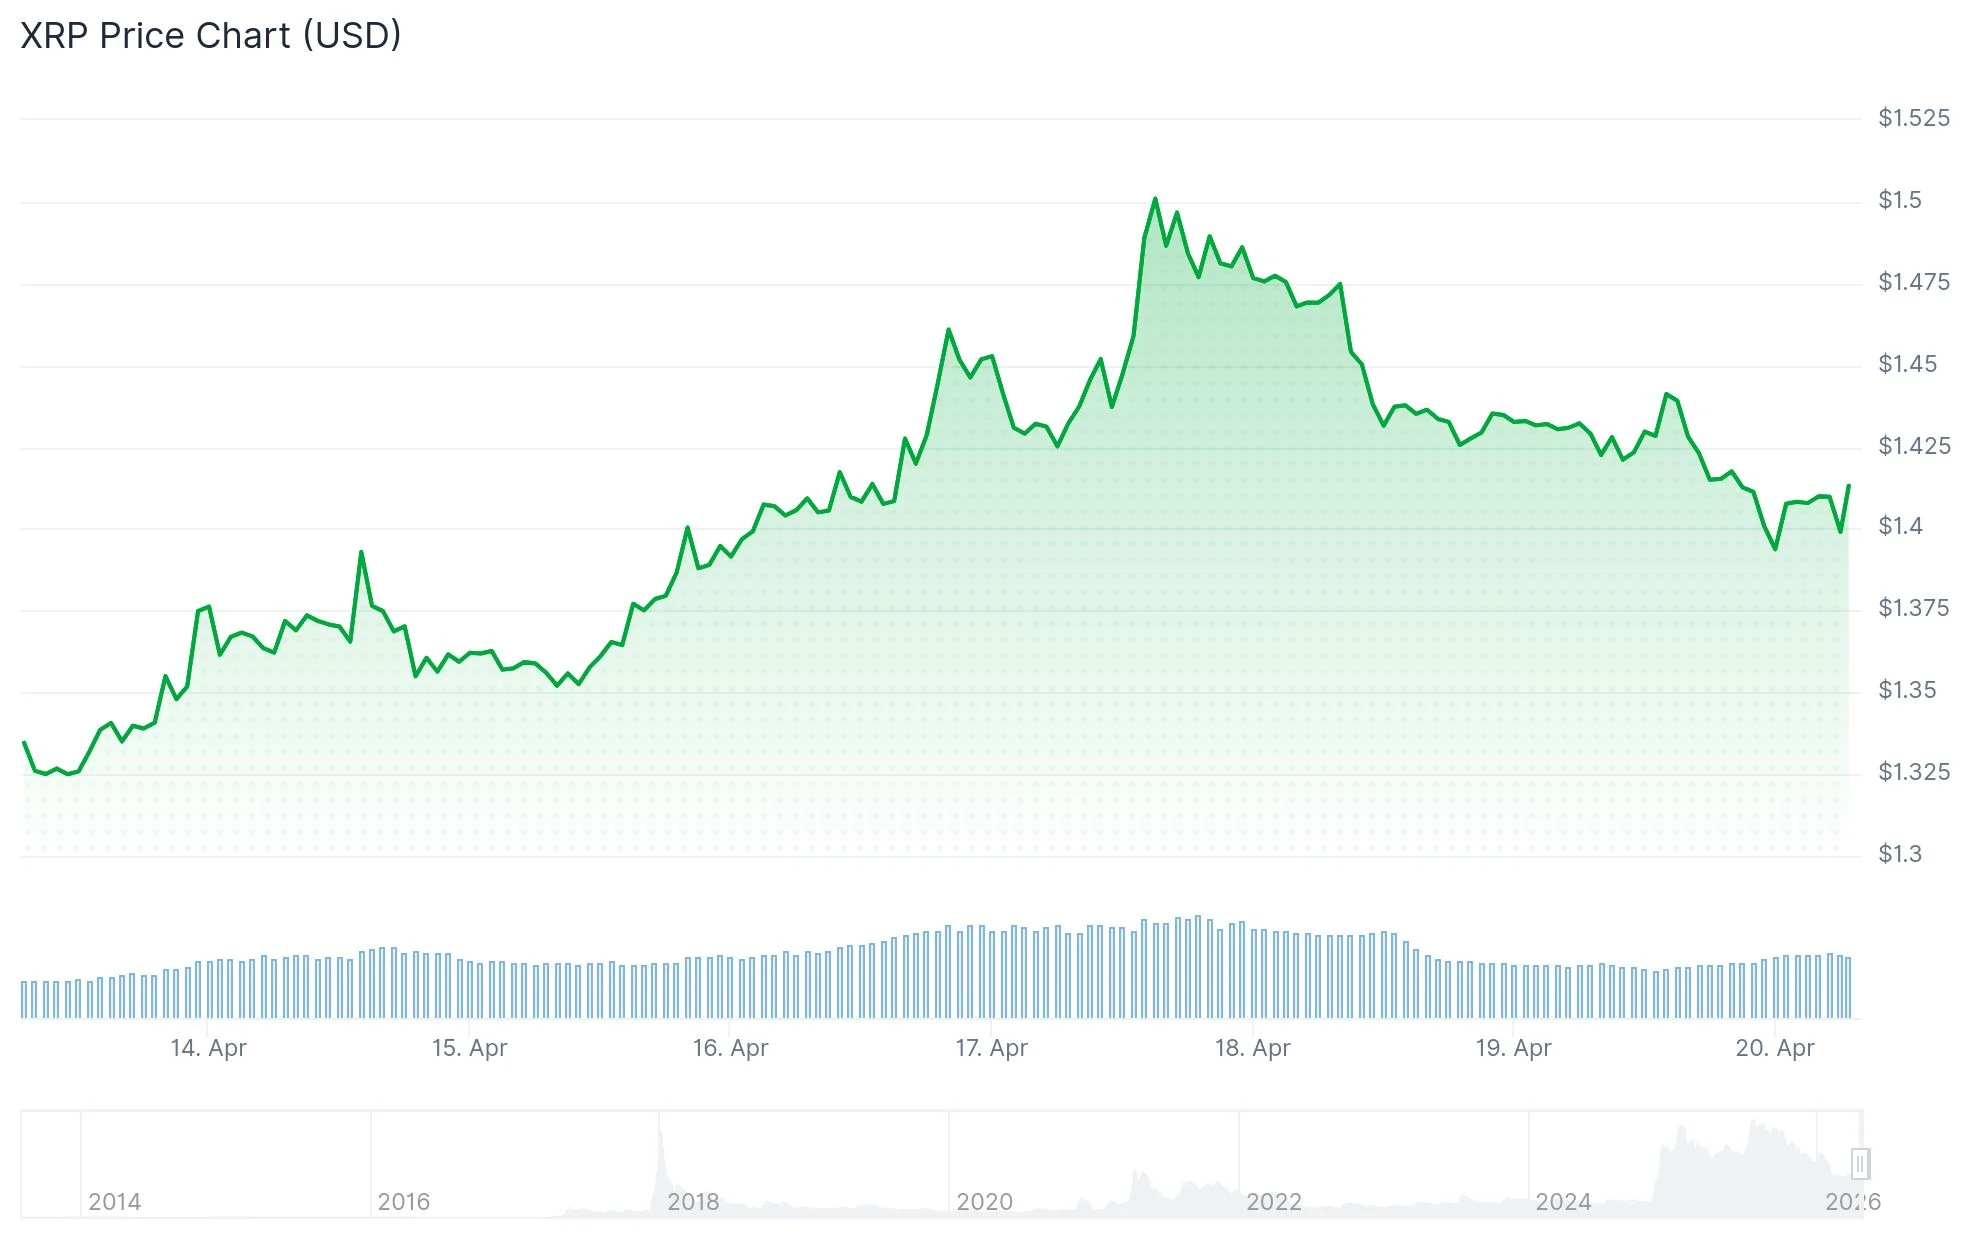
The $1.50 price point has consistently functioned as a formidable barrier in recent trading sessions. Market participants who accumulated positions at lower price points appear to be liquidating near this resistance level, creating significant selling pressure that has stalled upward momentum.
From a macroeconomic perspective, market participants are closely monitoring the Federal Reserve’s upcoming policy announcement scheduled for April 28. Any indication regarding interest rate adjustments could dramatically influence sentiment throughout cryptocurrency markets, with direct implications for XRP’s trajectory.
Meanwhile, Bitcoin has surged past the $77,000 mark while Ethereum broke above $2,300, triggering renewed purchasing activity across the digital asset ecosystem. Alternative cryptocurrencies including Solana, Cardano, and Dogecoin have similarly registered modest gains during this timeframe.
Capital Flows Continue Unabated
Investment products focused on XRP are maintaining strong capital attraction. Recent data reveals daily inflows of $13.74 million, elevating cumulative net inflows to $1.27 billion. This sustained capital movement indicates persistent institutional appetite for exposure to the asset.
U.S.-listed spot Bitcoin exchange-traded funds recorded $664 million in inflows during a single trading session, representing the fourth consecutive day of positive net flows. Spot Ethereum ETFs attracted $127 million, continuing their seven-day streak of capital additions.
Technical Analysis Breakdown
From a technical standpoint, Ripple remains confined within well-defined boundaries. Daily chart analysis reveals support anchored around $1.35 with resistance capping advances at $1.50. The MACD indicator is exhibiting gradual upward momentum, while histogram bars are contracting—signals that bearish pressure may be dissipating.
The Relative Strength Index hovers near 54, reflecting a neutral market condition. Current positioning suggests neither buyers nor sellers have established dominance.
Cryptocurrency analyst Ali Charts highlighted on X that XRP is developing a symmetrical triangle formation, a technical pattern frequently associated with sharp directional moves. According to Ali Charts, this configuration suggests a potential 35% price movement, though the breakout direction remains uncertain.
Examining longer timeframes reveals a more cautious outlook. Ripple reached a peak above $3.00 during mid-2025 before entering a prolonged decline characterized by successive lower highs and lower lows. A significant volume-driven selloff in early February 2026 eliminated leveraged positions and reset market structure, yet price action has remained largely stagnant since.
XRP’s 30-day Realized Volatility Index has contracted to approximately 0.42, representing the lowest measurement recorded since 2024. Historical analysis indicates that such extreme volatility compression typically precedes significant directional moves rather than prolonged consolidation.
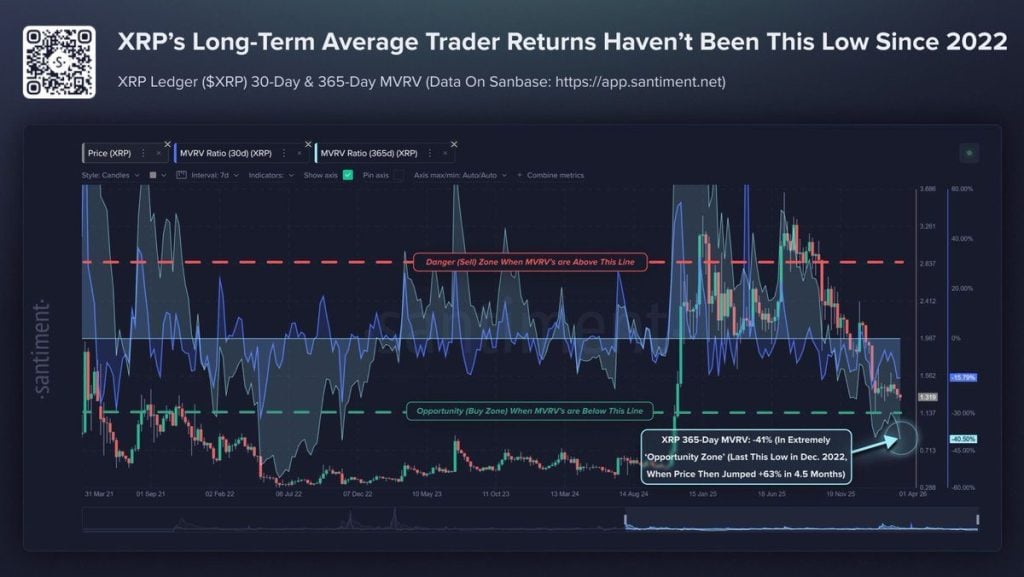
On-chain metrics reveal that the majority of holders remain in unrealized loss positions. The MVRV ratio has declined to levels characteristic of previous market capitulation phases, while the percentage of supply in profit remains subdued. XRP has depreciated roughly 30% over the trailing twelve-month period.
The critical price level requiring attention is $1.50. A decisive breakthrough and sustained trading above this threshold would represent the first conclusive indication of trend reversal. Conversely, if the $1.30 support level fails to hold, there exists minimal identifiable support infrastructure below that point.