
 Slides 8% Amid Geopolitical Turmoil — Critical Support Zones Ahead")
Key Highlights
- Ethereum fell beneath $2,350, currently hovering around $2,253 following a breakdown from $2,420 resistance
- Hourly chart shows a descending trend line forming with immediate resistance positioned at $2,300
- Spot Ethereum ETFs recorded $276 million in aggregate net inflows during the previous week, with Fidelity’s FETH contributing $126 million
- Staked ETH now represents over 32% of total supply, reducing liquidity available on trading platforms
- Net Taker Volume indicator has shifted into positive territory at approximately +$102 million since March, indicating renewed buyer interest
Ethereum experienced a notable decline from $2,465 down to $2,253 during a pronounced bearish movement. Currently, the asset is trading beneath its 100-hour Simple Moving Average and the 23.6% Fibonacci retracement level calculated from the recent price swing.
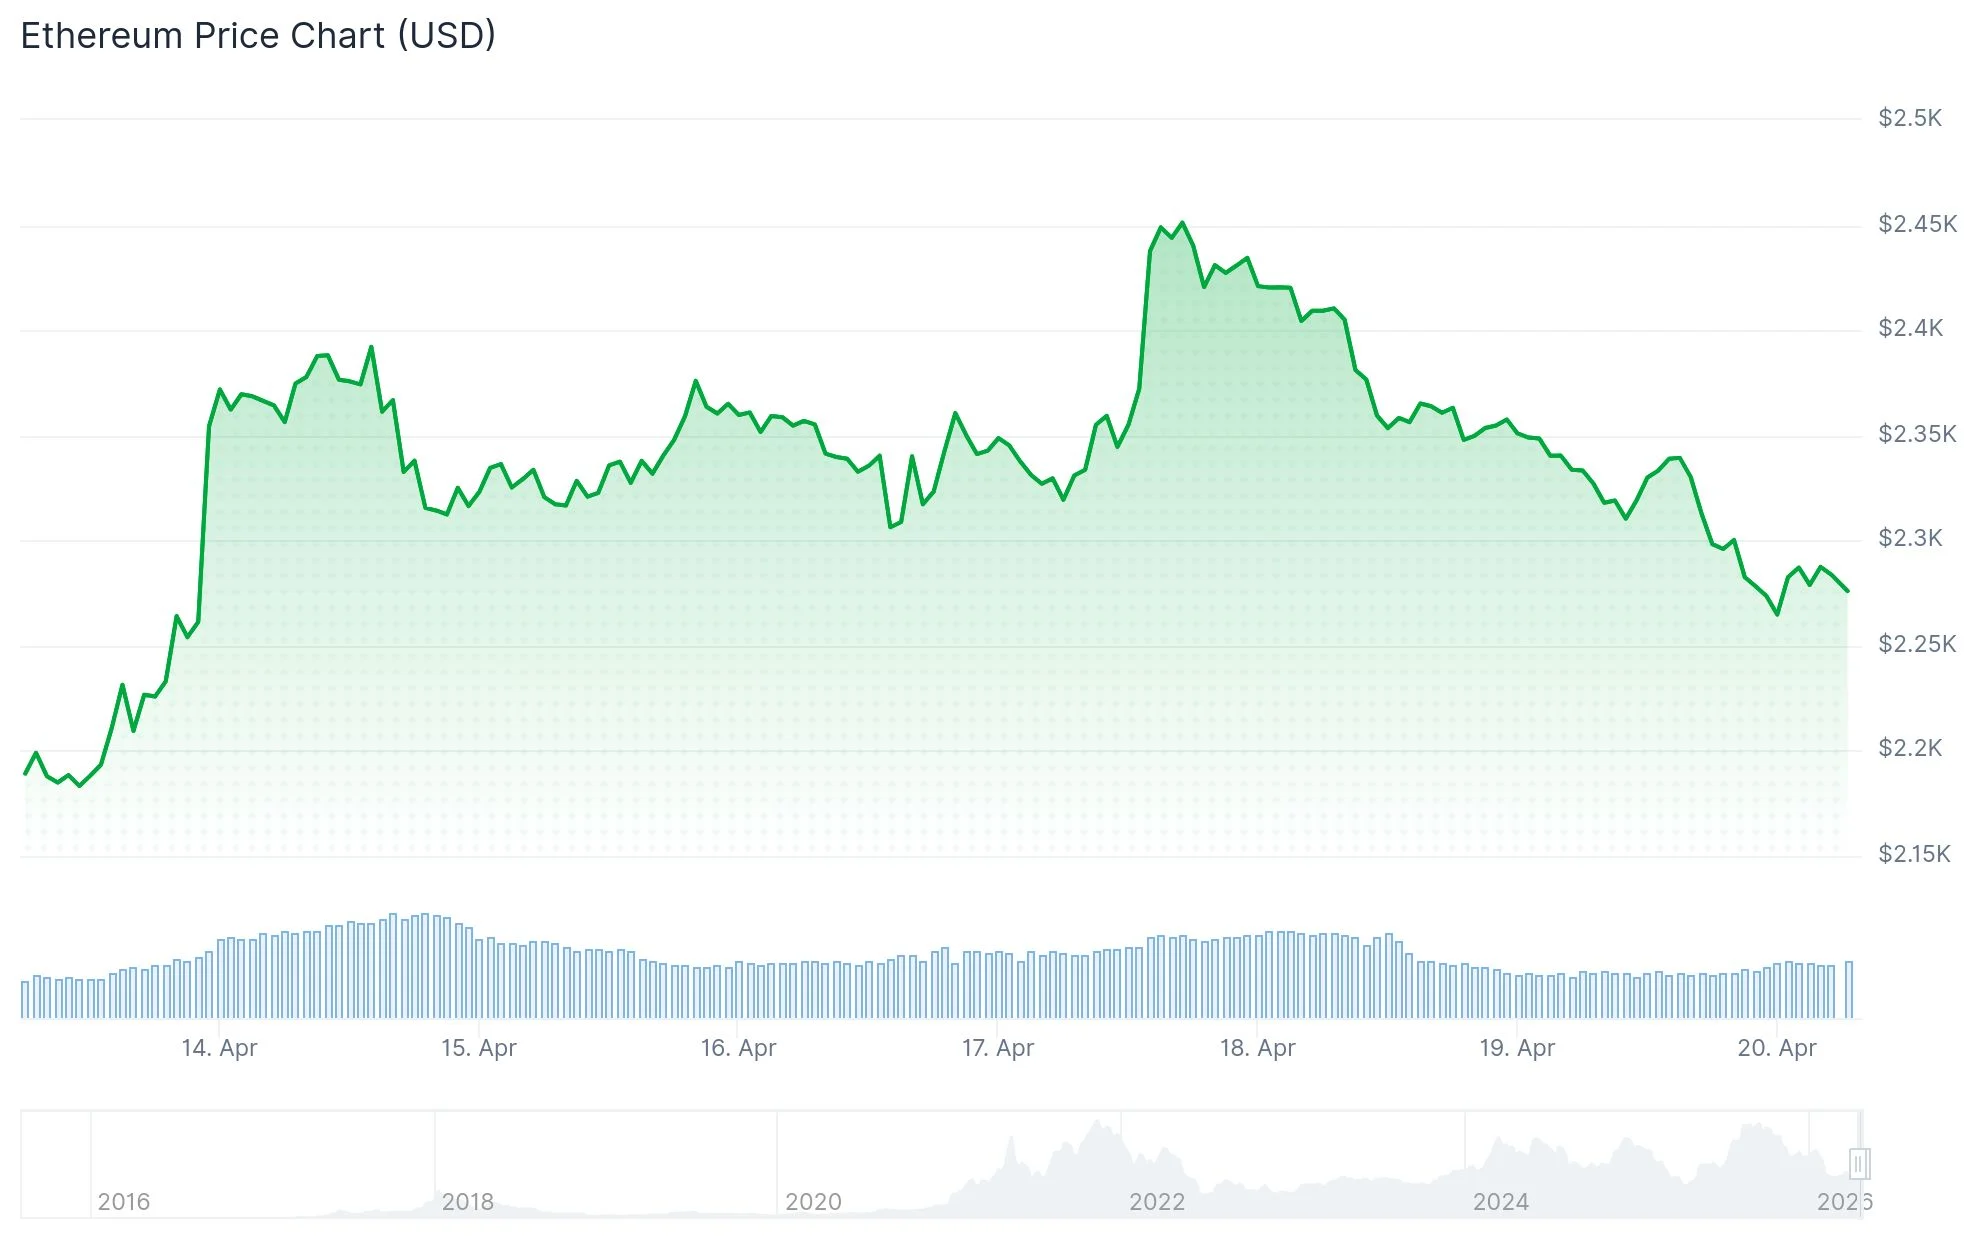
Technical analysis reveals a descending trend line on the hourly ETH/USD chart, establishing resistance around the $2,300 mark. The cryptocurrency is maintaining a position just above $2,250, a threshold that market analysts consider crucial for near-term price stability.
Should Ethereum successfully defend the $2,250 level, a potential recovery attempt could materialize. Initial resistance barriers are located at $2,300, followed by $2,335. A decisive break above $2,360—corresponding to the 50% Fibonacci retracement of the recent downward move—could pave the way toward $2,415 and potentially $2,465.
Conversely, failure to maintain support at $2,220 could trigger further declines toward $2,200, with subsequent targets at $2,150 and potentially $2,120.
Institutional Demand Remains Robust
Despite unfavorable price movements, Ethereum spot ETFs demonstrated considerable strength during the week spanning April 13-17, accumulating $276 million in net capital inflows. Fidelity’s FETH dominated the inflow activity with $126 million for the week, elevating its cumulative net inflows to $2.36 billion.
BlackRock’s ETHA secured the second position with $99.2 million in weekly inflows. The fund’s total historical net inflows have now reached $11.83 billion. Grayscale’s ETHE was the sole product experiencing capital outflows, recording a $16.7 million reduction. Collectively, Ethereum spot ETFs manage $14.26 billion in total net assets.
Supply Dynamics and Market Structure
Currently, more than 32% of the entire Ethereum supply is locked in staking protocols, effectively withdrawing a substantial volume from active market circulation. This development constrains available supply on centralized exchanges and contributes to thinner order books.
CryptoQuant analytics indicate that perpetual futures trading volume reached $34.74 billion, significantly exceeding spot market volume of $14.29 billion—evidence that traders favor derivatives instruments over direct spot purchases. Open interest contracted by 5.75% to $31.18 billion, while funding rates have dipped into negative territory, suggesting mounting short-side pressure.
Nevertheless, emerging data points suggest accumulation may be underway. The Net Taker Volume metric has rotated positive to approximately +$102 million since March, marking a reversal from the intense selling activity observed during previous price rallies, which registered -$568 million near the $5,000 level.
Based on current market data, ETH remains below $2,350, with immediate price trajectory dependent on whether buyers can successfully protect the critical $2,250 support zone.