
 Under Pressure: Analyst Eyes Potential Drop to $1,800")
Key Takeaways
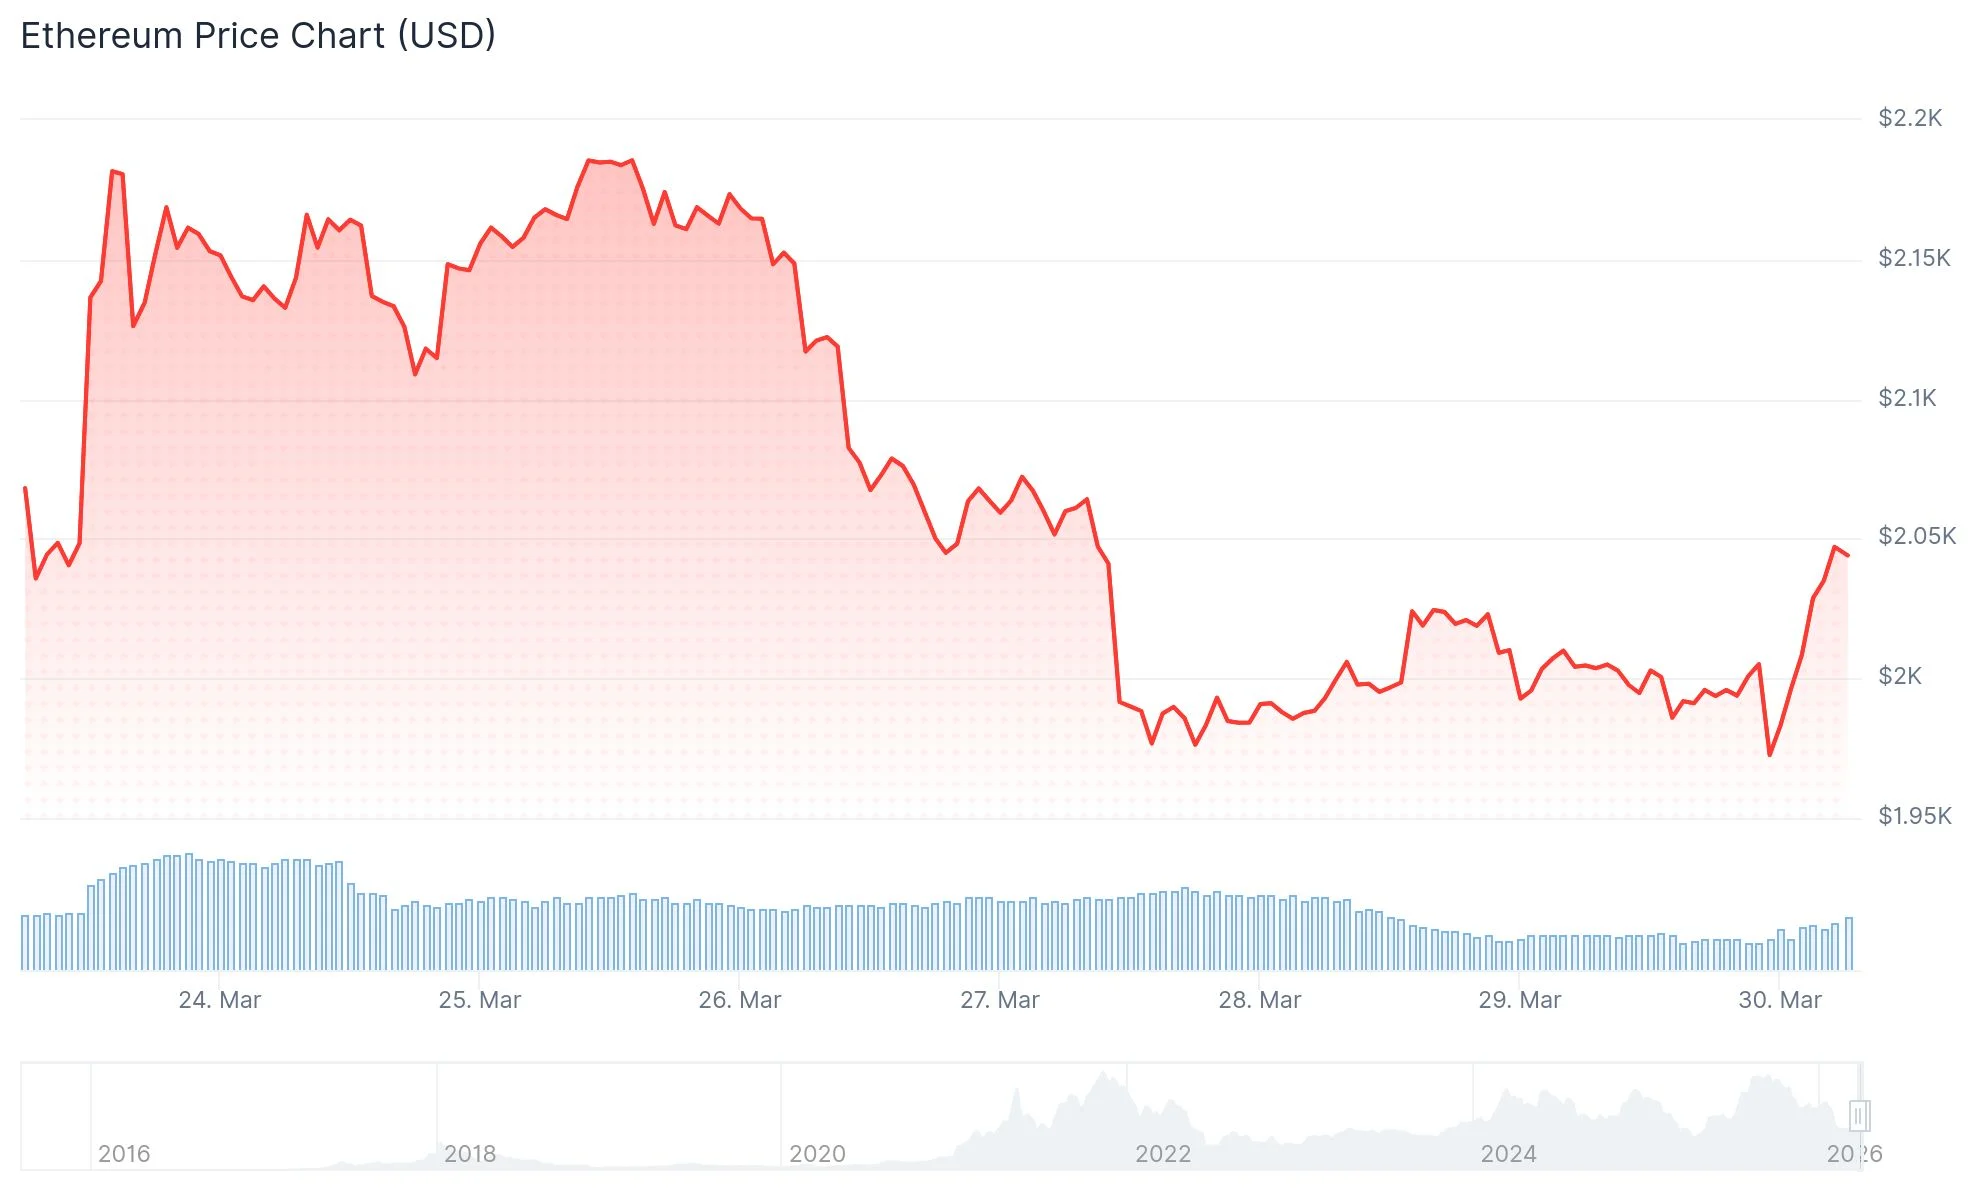
- ETH maintains position near $2,000 support following rejection at $2,372 resistance earlier in March.
- Long/short ratio has surged to 2.4, creating potential for a squeeze as price action remains stagnant.
- Ethereum ETFs listed in the U.S. experienced $92.5 million in net outflows on March 26.
- Selling pressure intensified following a massive $14.16 billion Bitcoin options expiration and escalating geopolitical concerns.
- Critical resistance zone established at $2,138–$2,151, while a breach below $1,980 could trigger deeper retracement.
Ethereum continues to hover around the $2,048 level as market participants work to defend the psychologically significant $2,000 support zone. After pushing higher earlier this month, the digital asset encountered strong resistance near $2,372. Following that rejection, ETH has remained confined within a consolidation pattern between $1,900 and $2,200.
Currently, the asset trades beneath the 50-day exponential moving average, positioned around $2,160, and remains significantly below the 100-day EMA near $2,420. This configuration suggests the prevailing trend remains bearish.
The daily Relative Strength Index registers approximately 44, positioned below the neutral threshold of 50. Meanwhile, the MACD indicator trades beneath its signal line while drifting toward the zero mark. These technical signals collectively indicate diminishing bullish momentum.
Market participants are paying particular attention to the long/short ratio, which has climbed to approximately 2.4. This metric reveals that significantly more traders hold long positions, anticipating price appreciation. However, the price action hasn’t validated this positioning.
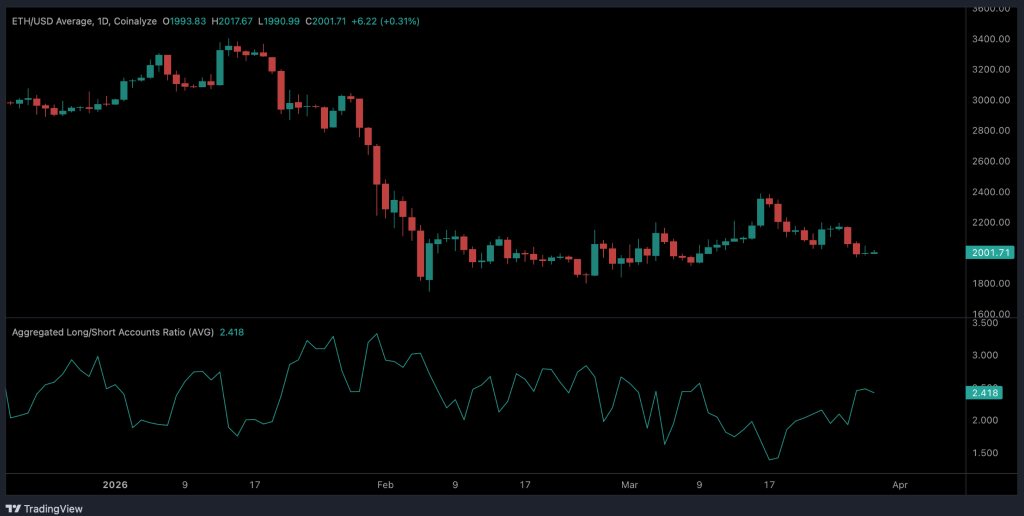
When long positions accumulate without corresponding upward price movement, it establishes what market analysts refer to as an overcrowded position. Such configurations increase vulnerability to a long squeeze scenario, where sudden downward price movement forces leveraged long holders to liquidate their positions, amplifying the decline.
Institutional Selling and Broader Market Dynamics
U.S.-based Ethereum exchange-traded funds registered $92.5 million in net outflows on March 26. These redemptions occurred as part of a wider trend affecting cryptocurrency investment products.
The preceding day, March 27, witnessed a historic $14.16 billion Bitcoin options contract expiration. Such substantial derivative expirations frequently generate market volatility, and this event contributed to selling pressure throughout the cryptocurrency sector.
Macroeconomic and geopolitical developments also influenced market sentiment. Crude oil prices climbed following Iran’s threats regarding a critical shipping corridor, raising inflation expectations. Such conditions typically create headwinds for speculative assets including Ethereum.
Critical Price Levels Under Observation
On the resistance side, the $2,138 level represents the 23.6% Fibonacci retracement calculated from the peak at $3,402 down to the trough at $1,747. The Ichimoku Kijun indicator sits at $2,151, and market technicians view a decisive close above this area as potentially catalyzing a rally toward $2,380.
Regarding support, the initial level to monitor is $1,990. Below that threshold, the lower boundary of the trading channel rests near $1,748. A confirmed breakdown beneath this zone could extend the bearish price trajectory.
Technical projections suggest ETH will likely remain range-bound between $1,980 and $2,170 over the coming five sessions, with the likelihood of upward price movement estimated below 20%.
Market analyst Ali Charts shared on X that Ethereum approaches a “major test at $1,800,” indicating that some technical observers anticipate substantially lower levels if current support structures fail.
Notably, analyst Tom Lee has projected Ethereum could eventually reach $62,000 in the longer term, although no specific timeframe accompanied this forecast.
With Ethereum ETF outflows totaling $92.5 million on March 26 and ETH consolidating near $2,000, technical indicators suggest continued near-term pressure as the asset tests critical support zones.