
 Surges Past $648 as Futures Market Shows Strong Bullish Sentiment")
Key Takeaways
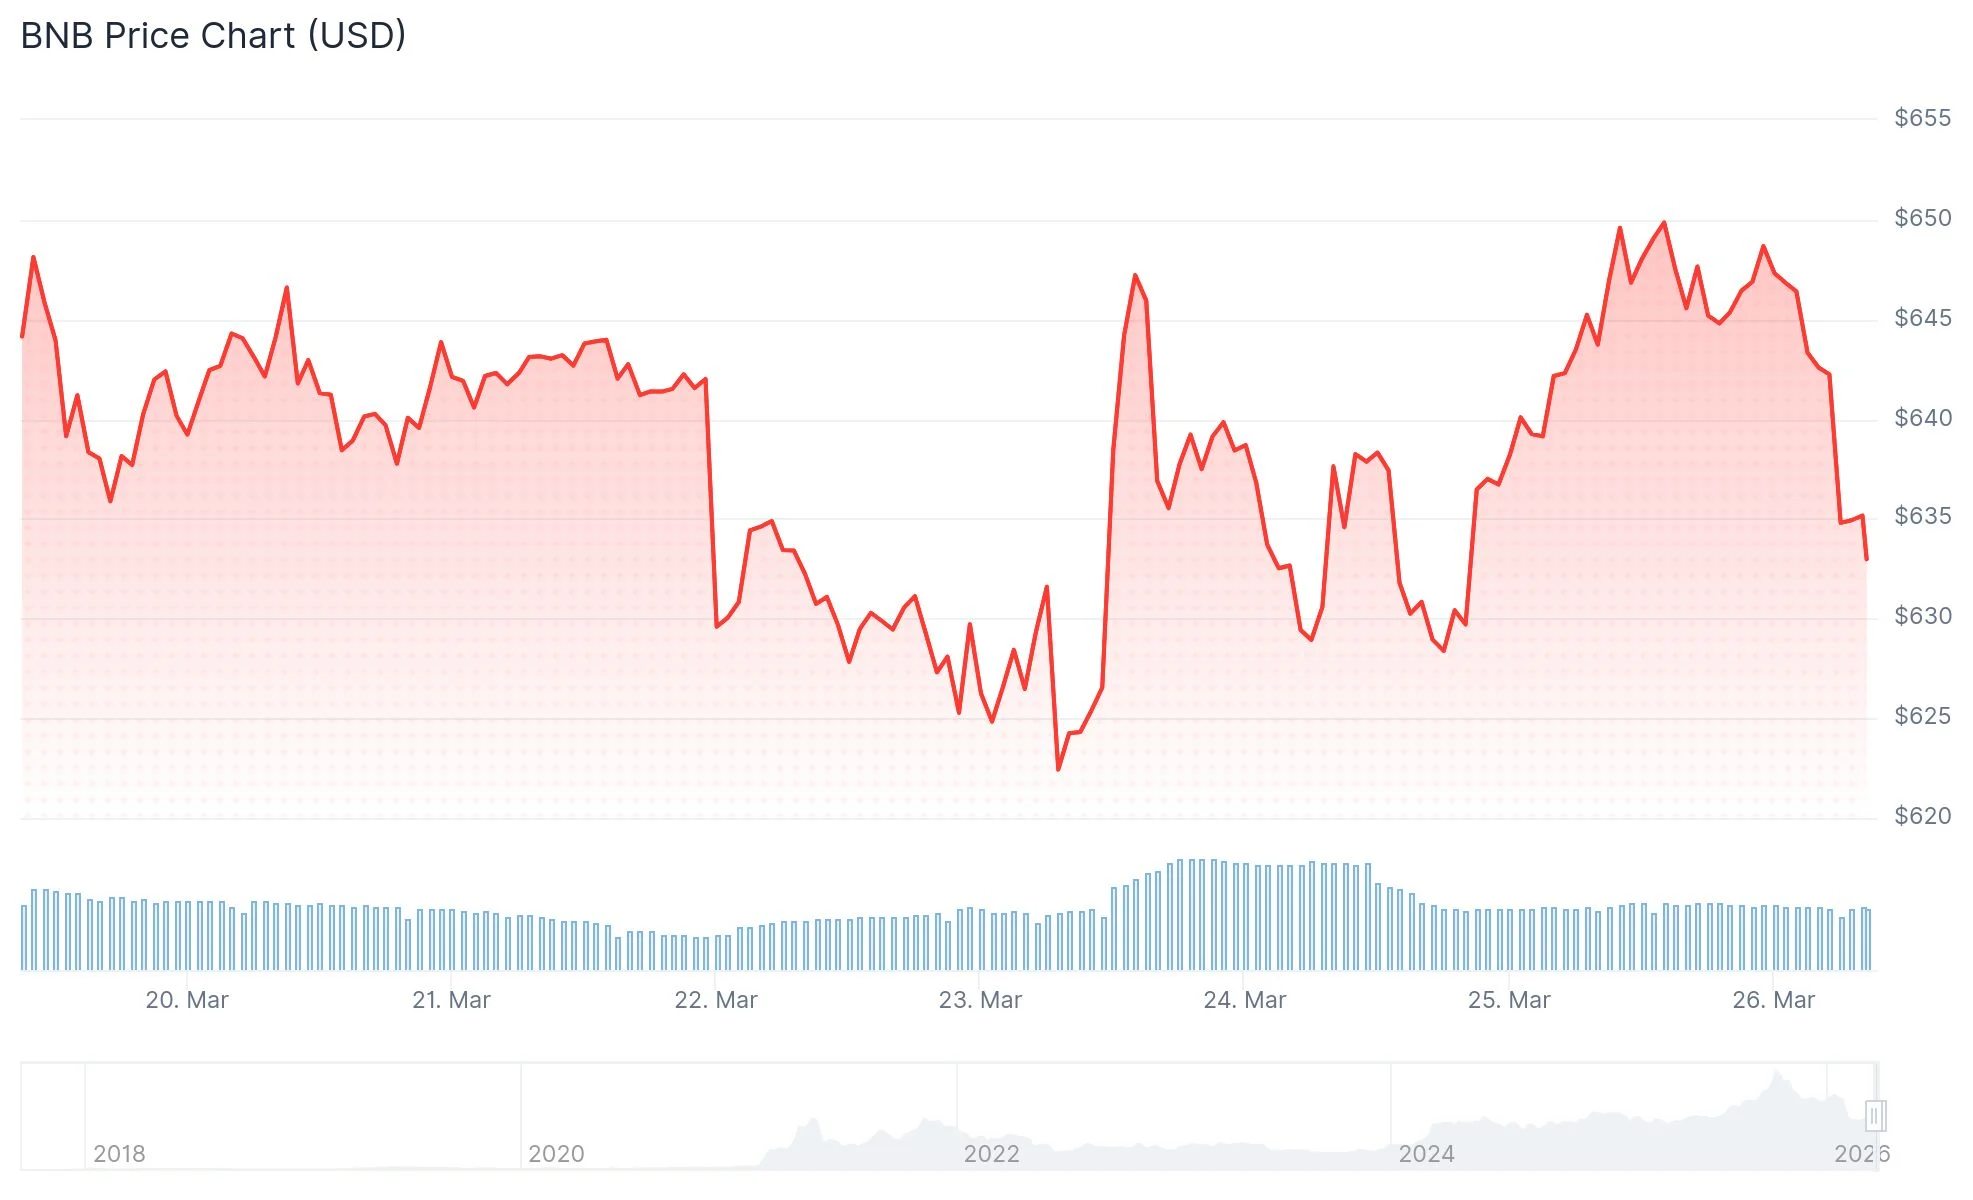
- Binance Coin rebounded from $627 to approximately $648, driven by strengthening market conditions.
- Futures open interest climbed 6.5% to reach $923 million, while Binance’s long/short ratio exceeded 2.21.
- The token maintains position above a critical ascending trendline within a bullish parallel channel structure.
- A golden cross formed as the 20-day SMA moved above the 50-day SMA, currently trading 53% beneath its record high.
- Expert projections suggest price objectives between $2,000 and $5,000, supported by cycle analysis and blockchain metrics.
Binance Coin reversed from a weekend low of $627 and recovered to the $648 level by Monday, March 25. This upward movement aligned with improving sentiment across cryptocurrency markets as diplomatic tensions between the United States and Iran showed signs of de-escalation.
Crude oil valuations retreated from triple digits to approximately $87 per barrel amid declining geopolitical concerns. Bitcoin advanced beyond the $71,000 threshold while Ethereum pushed toward $2,200 during this timeframe. Major Asian equity indices, including Japan’s Nikkei 225, Hong Kong’s Hang Seng, and the Shanghai Composite, registered positive sessions.
Data from CoinGlass indicates that BNB’s futures open interest expanded by 6.5% over a 24-hour period, reaching $923 million. On Binance, the long/short ratio registered above 2.21, demonstrating that bullish positions significantly outnumber bearish ones among derivatives traders.
Chart Analysis Suggests Bullish Continuation
Examining the daily timeframe reveals BNB trading within a well-defined ascending parallel channel. The cryptocurrency has successfully defended its lower channel boundary, which has provided reliable dynamic support across multiple tests in recent weeks.
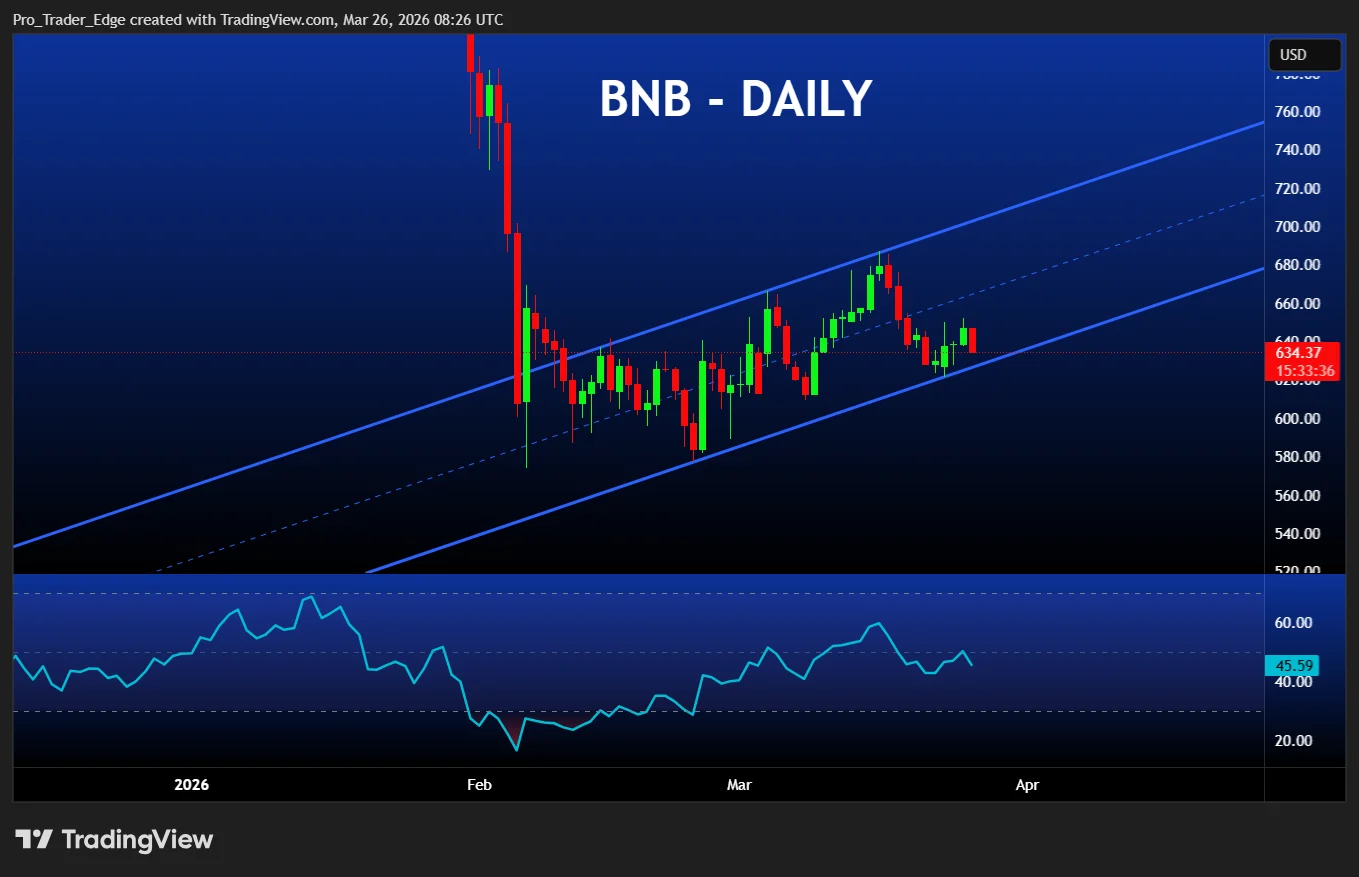
A golden cross has materialized as the 20-day simple moving average (SMA) crossed above the 50-day SMA. This technical development typically indicates strengthening short-term momentum favoring buyers. The relative strength index (RSI) is trending toward neutral territory, implying additional upside potential remains before overbought conditions emerge.
Traders are monitoring $685 as the immediate resistance barrier, a level that previously rejected multiple advance attempts earlier this month. Successfully clearing this threshold could establish a pathway toward the 100-day SMA positioned near $750. Conversely, breaking below $600 would challenge the prevailing bullish structure.
With BNB positioned 53% below its historical peak, substantial recovery potential exists should favorable market conditions persist.
Cryptocurrency analyst Crypto Patel highlighted BNB’s current discount from all-time highs, referencing historical patterns, ongoing token burn mechanisms, and robust fundamentals as justification for long-term price targets spanning $2,000, $5,000, and potentially $10,000, while identifying $300 to $420 as an optimal accumulation range.
Token Burns and Platform Utility Drive Underlying Demand
BNB maintains consistent demand through its integral role within the Binance ecosystem. The token facilitates transaction fee payments, provides trading fee discounts, and powers various blockchain applications, establishing sustained baseline demand.
Supply dynamics remain favorable due to programmed token burn events. These systematic burns progressively reduce total circulating supply. Market observers regard this deflationary mechanism as a long-term price catalyst, particularly when combined with expanding network activity.
The previously established accumulation range of $300 to $420 has been exceeded, while cycle-based forecasting models now identify $2,000 to $5,000 as realistic objectives. These estimates derive from historical pattern recognition and structural market analysis.
As of March 26, Binance Coin trades around $648 with the $600 support zone remaining defended.