
 Slides to $2,100 as Market Reaches Historic MVRV Buy Territory")
Key Takeaways
- The MVRV ratio for Ethereum has fallen into the historical buy range of 0.8 to 1.0, indicating potential market value realignment
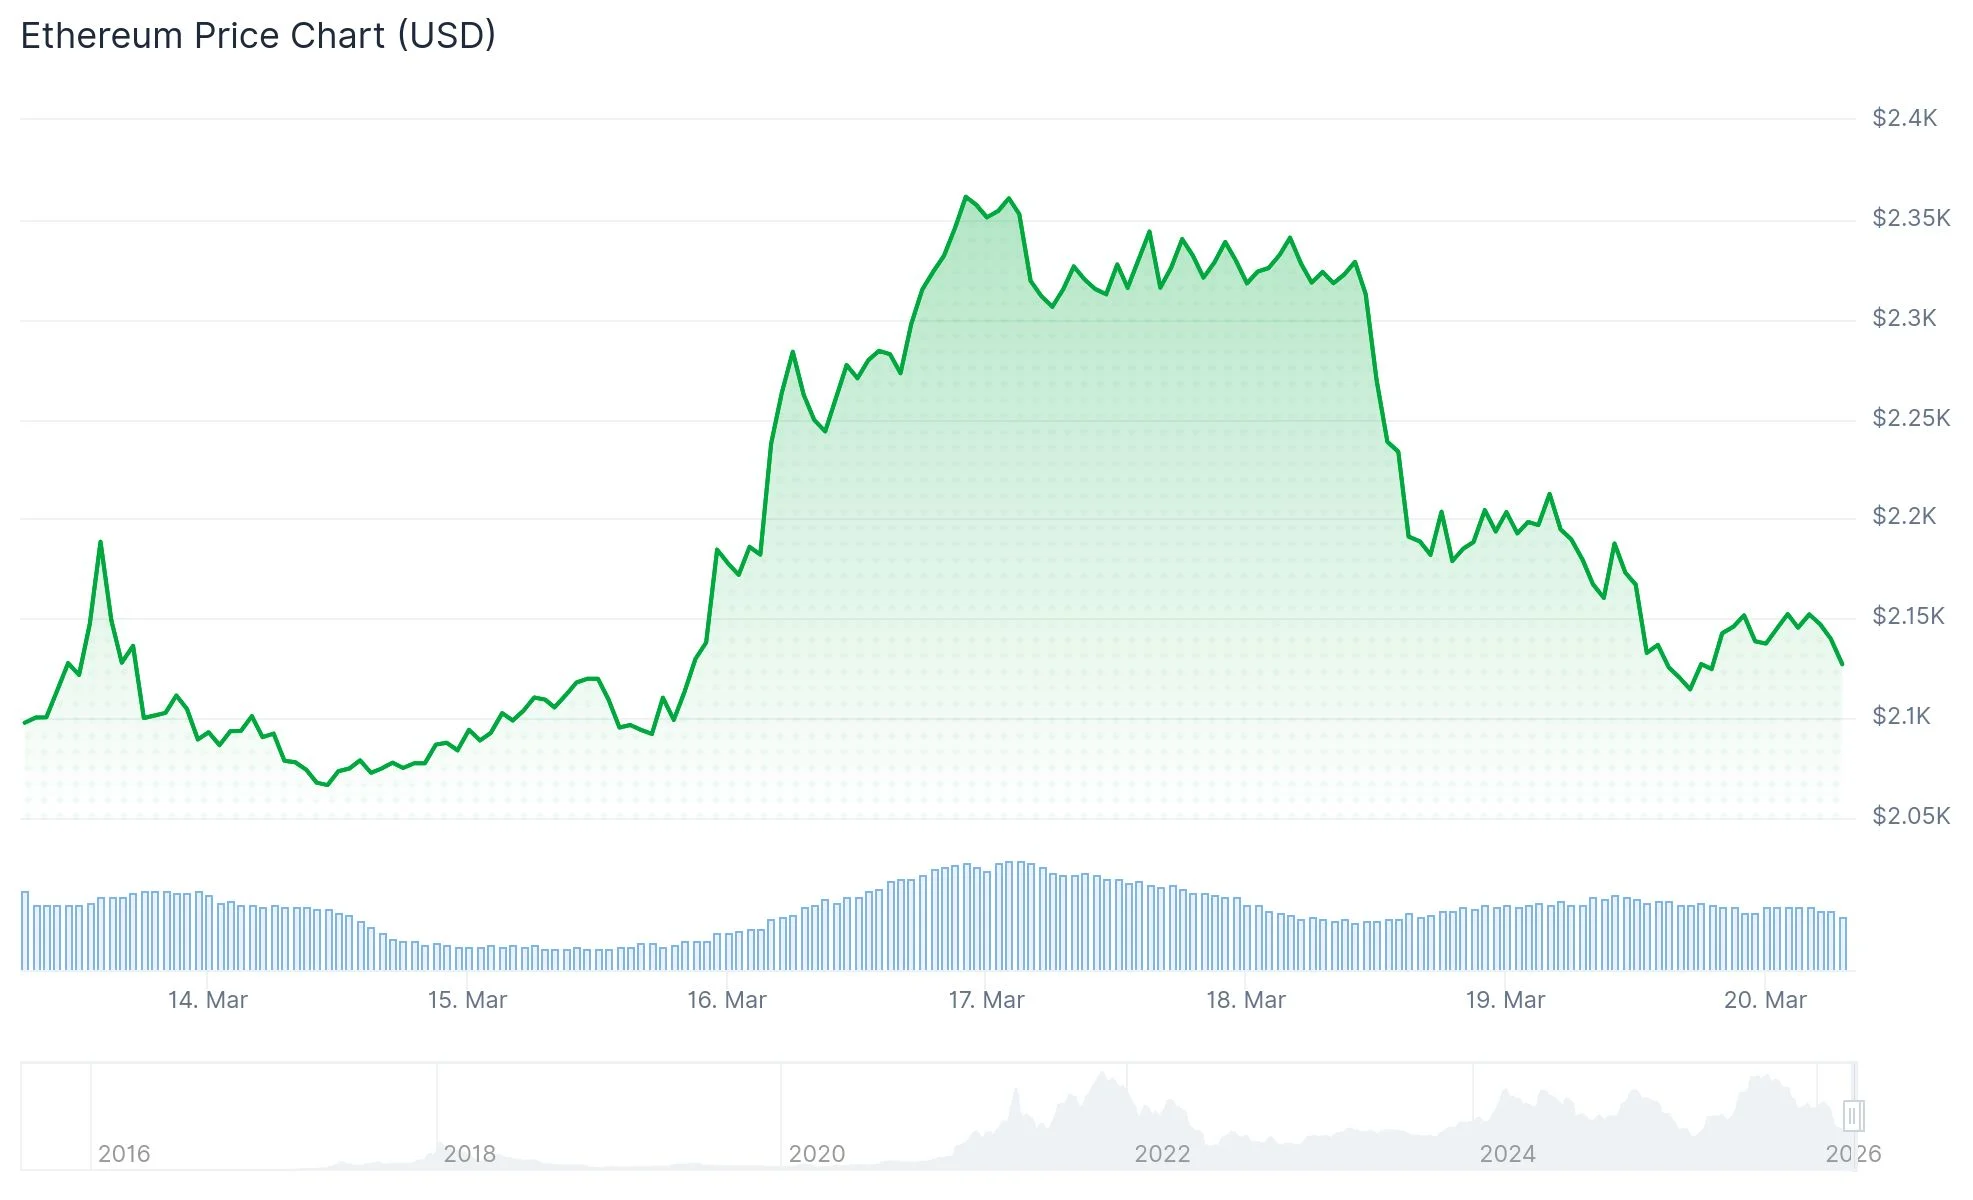
- After facing rejection at $2,400, ETH plummeted to $2,100
- Current trading occurs beneath the $2,200 mark and below the 100-hourly Simple Moving Average
- Critical near-term support lies between $2,100 and $2,150, with additional downside protection around $1,770
- Breaking above $2,200 could trigger upward momentum toward $2,240, $2,275, and possibly $2,385
Ethereum has retreated to approximately $2,100 following a steep decline from the $2,385 zone. The cryptocurrency breached multiple support levels at $2,320 and $2,250, ultimately breaking through a significant upward trend line that had provided support around $2,160 on shorter timeframes.
The recent bottom reached $2,100, with ETH now consolidating marginally above this threshold. The current position sits beneath the 23.6% Fibonacci retracement level calculated from the $2,385 to $2,100 decline.
Additionally, Ethereum trades underneath its 100-hourly Simple Moving Average, reinforcing the near-term bearish momentum.
The initial resistance barrier stands at $2,165, with the subsequent hurdle at $2,200, coinciding with the 100-hourly SMA. Reclaiming territory above $2,200 represents a crucial milestone for bulls attempting a reversal.
Should Ethereum successfully breach $2,200, traders will focus on $2,240, which aligns with the 50% Fibonacci retracement level, followed by $2,275 and $2,320. More substantial buying pressure could propel prices toward $2,385.
Conversely, failure to hold $2,100 would expose support zones at $2,060 and $2,020. The psychological $2,000 threshold represents a critical defensive line.
Historic MVRV Buy Signal Emerges
From a broader perspective, Ethereum’s Market Value to Realized Value (MVRV) ratio has descended into the 0.8 to 1.0 territory. Based on analysis from Ali Charts utilizing Glassnode metrics, this range has historically preceded substantial multi-month rallies.
https://twitter.com/alicharts/status/2034559606668570900?s=20
Historical recoveries from comparable MVRV zones have generated returns ranging from approximately 129% to exceeding 5,000%, although market dynamics varied considerably across different cycles. While this indicator doesn’t guarantee immediate price appreciation, it suggests potentially limited downside compared to valuations observed near recent peaks.
ETH achieved a cycle peak around $4,955 before entering this corrective phase. Trading near $2,100 reflects a decline exceeding 57% from that maximum.
Technical Analyst Highlights $2,150 as Critical Threshold
Market analyst Ted Pillows shared insights on X regarding Ethereum’s technical position. His analysis emphasized the forceful rejection experienced at $2,400 resistance, with ETH now retesting $2,150 as a potential stabilization point.
https://twitter.com/TedPillows/status/2034554720593772615?s=20
The technical chart presented by Ted Pillows illustrates a pattern characterized by descending peaks, where successive bounces have failed to generate meaningful upward momentum. This formation maintains the possibility of additional downside pressure should support levels fail.
The $2,150 area corresponds with a previous consolidation zone and remains under close observation as a short-term inflection point.