
 Faces Massive Capital Flight as Network Usage Soars to New Heights")
Key Takeaways
- Daily active addresses on Ethereum reached an unprecedented ~2 million in February 2026, representing twice the volume recorded during the 2021 market peak
- Daily smart contract interactions exceeded 40 million, marking a new all-time high for network activity
- ETH value has declined more than 50% across a four-month period despite unprecedented network utilization
- Net capital flow into ETH has turned negative — realized capitalization indicates money is exiting the ecosystem
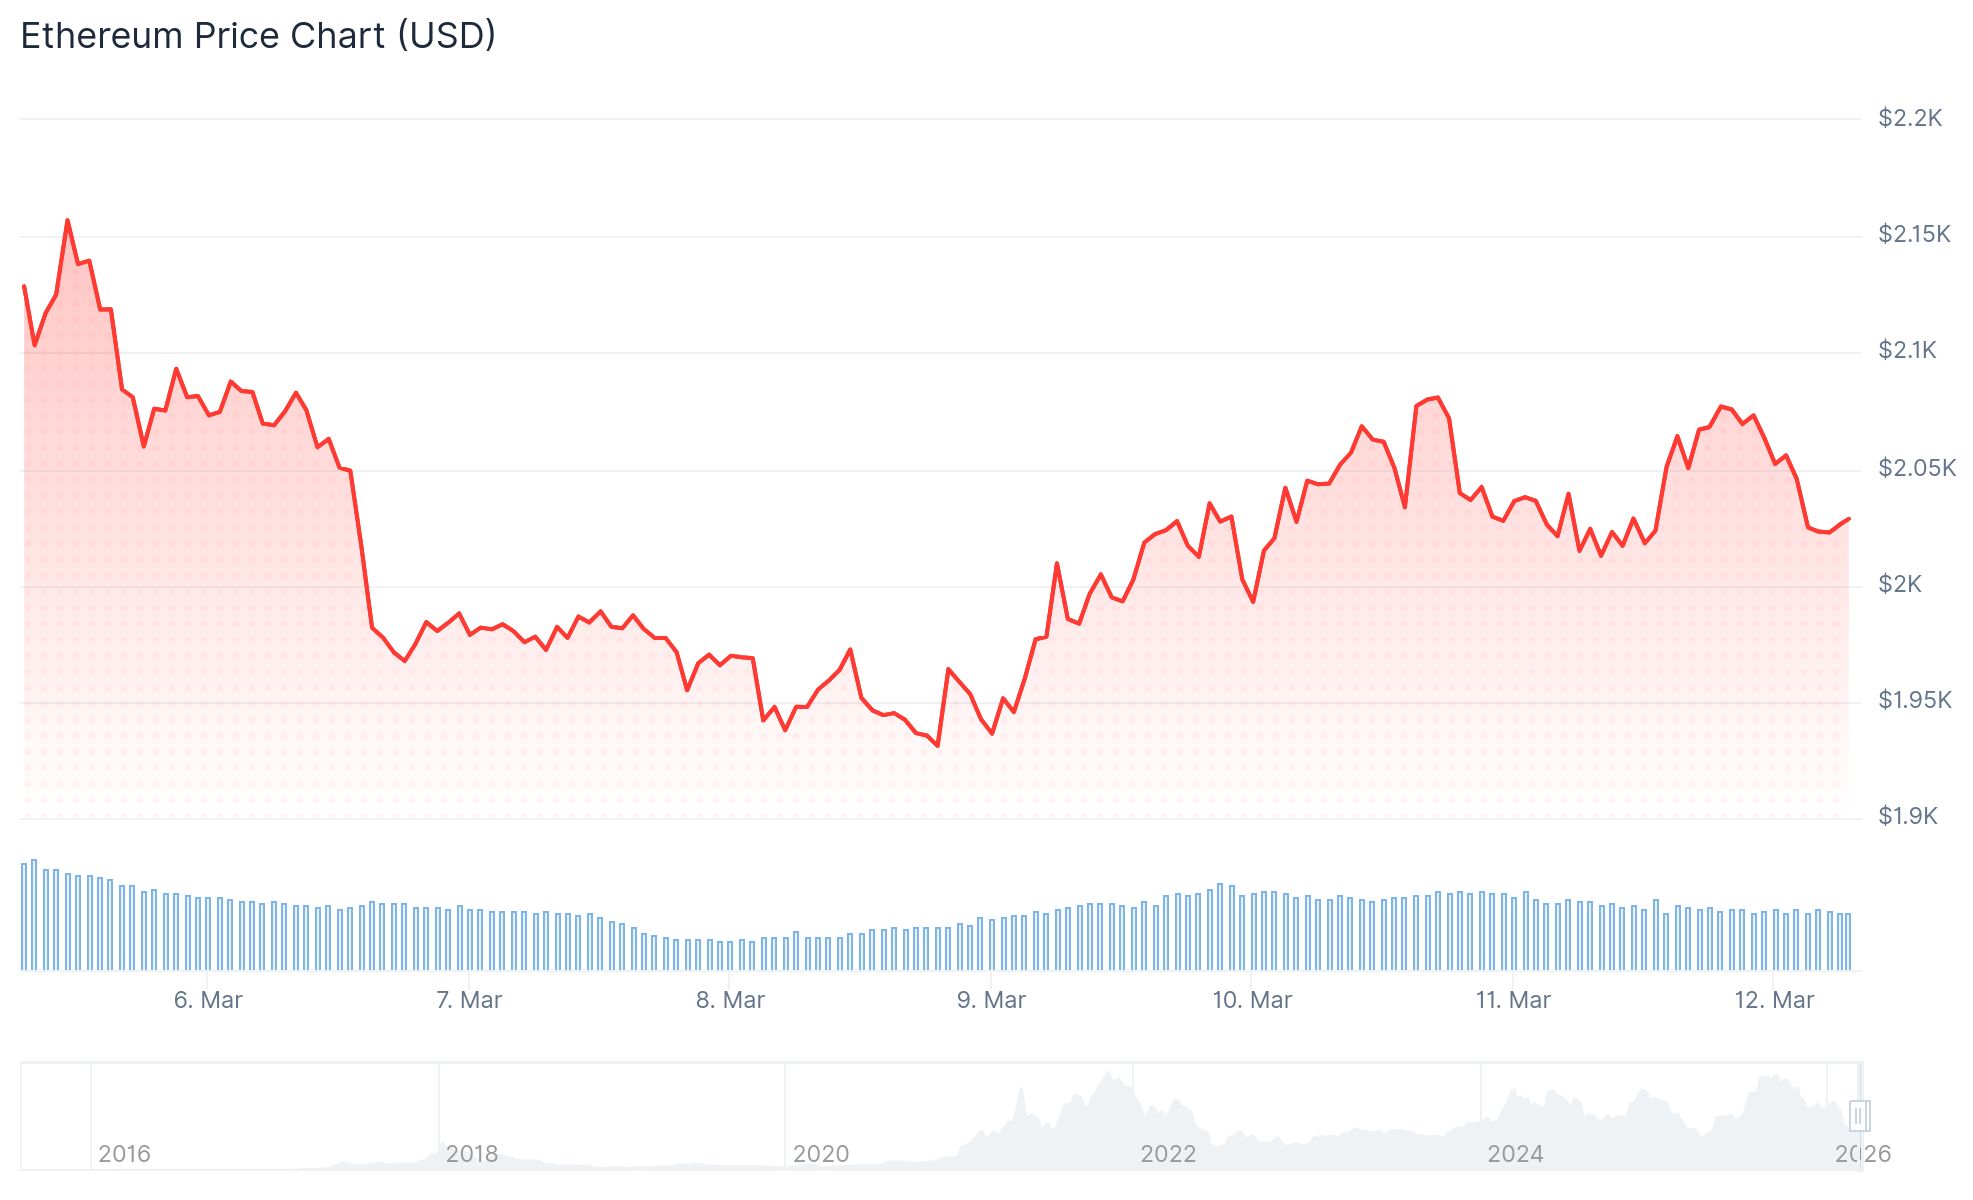
- Current ETH trading range sits between $2,020–$2,055, with critical resistance positioned at $2,080
The Ethereum blockchain is experiencing unprecedented activity levels. Yet ETH’s price action paints a starkly different picture.
Recent months have witnessed Ethereum’s fundamental usage metrics reaching record territory. The network processed approximately 2 million daily active addresses throughout February — representing a 100% increase from the peak observed during 2021’s bull cycle, based on CryptoQuant analytics.
Smart contract interactions have similarly shattered previous benchmarks. Current daily contract calls now consistently surpass 40 million, significantly exceeding the highs established during both the 2021 and 2018 bull markets.
Historically, such robust network expansion has correlated with upward price momentum. This cycle is proving to be an exception.
ETH’s valuation has contracted by over 50% during the past four months. CryptoQuant researchers indicate the traditional correlation between on-chain activity and price performance is deteriorating.
“The deteriorating correlation indicates that Ethereum’s growth at the application layer is no longer directly driving ETH price appreciation,” noted the CryptoQuant research team.
Money Is Flowing Away From Ethereum
The more critical narrative may center on capital migration patterns. ETH has experienced greater exchange deposits compared to Bitcoin in recent periods — indicating intensified sell-side pressure. This dynamic has historically coincided with local price peaks.
Ethereum’s realized capitalization metric — which tracks net capital movement — has flipped into negative territory. This signals that capital is exiting the network at a faster rate than it’s entering.

During 2021, an ascending realized cap accompanied ETH’s most significant price rallies. When this metric inverted in 2022, prices experienced sharp declines. Current market conditions are mirroring this historical pattern.
Current ETH Price Action
Ethereum is presently trading within the $2,020–$2,055 range. The asset successfully reclaimed the $2,000 psychological level following a rebound from $1,912 lows, though it now confronts resistance around $2,080.
The 20-day exponential moving average is positioned near $2,024, with ETH maintaining support slightly above this level. This threshold is considered crucial for determining near-term directional bias.
The 50-day EMA registers higher at approximately $2,219, indicating the intermediate trend remains bearish.
Should ETH successfully breach the $2,080–$2,135 resistance zone, subsequent upside targets include $2,200 and potentially $2,389. For downside scenarios, $1,980 represents the initial support level, with $1,910 serving as secondary support.
Liquidation data from Coinglass shows $43.3 million in forced closures during the past 24 hours — with $24.6 million attributed to short position liquidations.
ETH maintains its position above $2,000 for the moment. Market participants are closely monitoring the $2,080 level as the next critical inflection point.